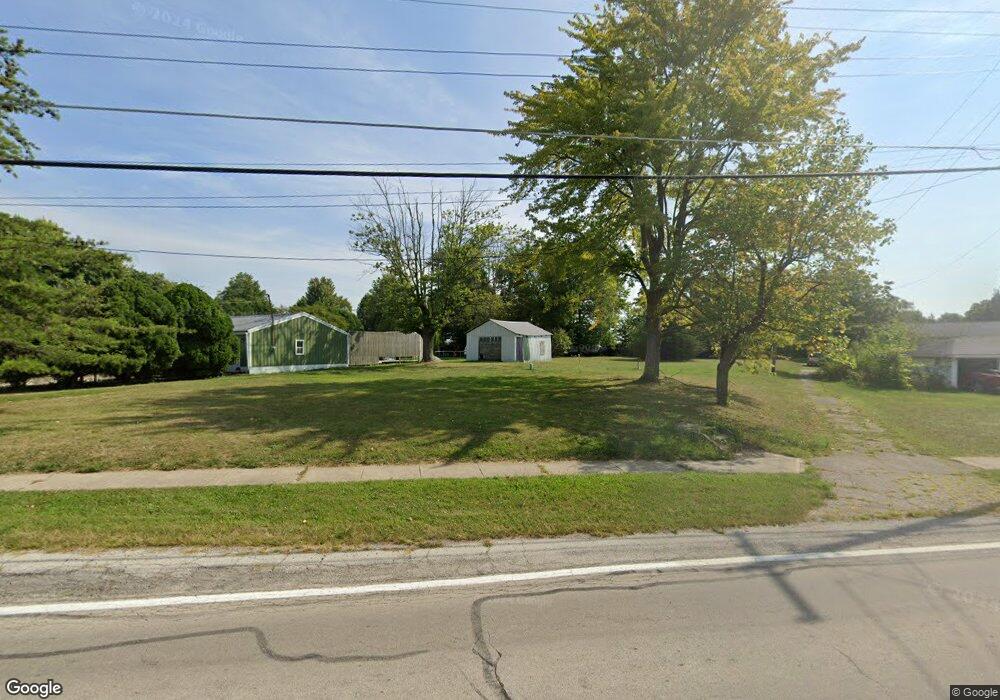
326 N Main St Wilkinson, IN 46186
Estimated Value: $39,000
3
Beds
1
Bath
1,368
Sq Ft
$29/Sq Ft
Est. Value
About This Home
This home is located at 326 N Main St, Wilkinson, IN 46186 and is currently estimated at $39,000, approximately $28 per square foot. 326 N Main St is a home located in Hancock County with nearby schools including Eastern Hancock Elementary School, Eastern Hancock Middle School, and Eastern Hancock High School.
Ownership History
Date
Name
Owned For
Owner Type
Purchase Details
Closed on
Dec 2, 2014
Sold by
Clarence S
Bought by
Chriswell S Clarence and Chriswell Georgia N
Current Estimated Value
Purchase Details
Closed on
Sep 14, 2007
Sold by
Perriman Julia N
Bought by
Chriswell S Clarence and Chriswell Georgia N
Create a Home Valuation Report for This Property
The Home Valuation Report is an in-depth analysis detailing your home's value as well as a comparison with similar homes in the area
Home Values in the Area
Average Home Value in this Area
Purchase History
| Date | Buyer | Sale Price | Title Company |
|---|---|---|---|
| Chriswell S Clarence | -- | None Available | |
| Chriswell S Clarence | -- | None Available |
Source: Public Records
Tax History Compared to Growth
Tax History
| Year | Tax Paid | Tax Assessment Tax Assessment Total Assessment is a certain percentage of the fair market value that is determined by local assessors to be the total taxable value of land and additions on the property. | Land | Improvement |
|---|---|---|---|---|
| 2024 | $600 | $30,000 | $30,000 | $0 |
| 2023 | $600 | $35,000 | $35,000 | $0 |
| 2022 | $424 | $21,200 | $21,200 | $0 |
| 2021 | $424 | $21,200 | $21,200 | $0 |
| 2020 | $424 | $21,200 | $21,200 | $0 |
| 2019 | $424 | $21,200 | $21,200 | $0 |
| 2018 | $424 | $21,200 | $21,200 | $0 |
| 2017 | $536 | $26,800 | $25,100 | $1,700 |
| 2016 | $528 | $26,400 | $24,700 | $1,700 |
| 2014 | $532 | $26,600 | $24,900 | $1,700 |
| 2013 | $532 | $26,600 | $24,900 | $1,700 |
Source: Public Records
Map
Nearby Homes
- 135 Pennsylvania St
- 0000 Pennsylvania St
- 0 Pennsylvania St Unit MBR22027178
- 0 Pennsylvania St Unit MBR22047696
- 132 Pennsylvania St
- 0 N Railroad St Unit MBR21989219
- 8961 E South St
- 126 Illinois St
- 0 N 1200 E Unit LotWP001
- 1200 North St
- 314 Main St
- 6052 N Deckshire Ln
- 0 County Road 1200 E
- 7333 E 650 N
- 10727 E 1100 N
- 7898 W County Road 350 S
- 1105 Lake Dr
- 5784 N 600 E
- 9020 W 650 S
- 0 Lake Dr