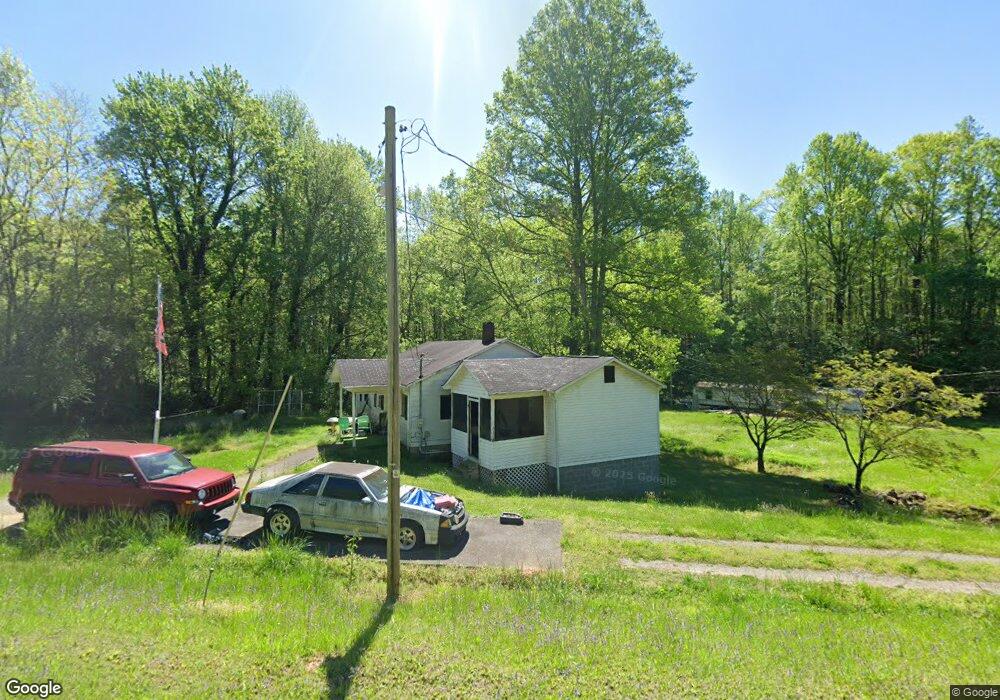
326 Nicholson Cir Turtletown, TN 37391
Estimated Value: $89,000 - $260,000
--
Bed
1
Bath
1,152
Sq Ft
$147/Sq Ft
Est. Value
About This Home
This home is located at 326 Nicholson Cir, Turtletown, TN 37391 and is currently estimated at $169,769, approximately $147 per square foot. 326 Nicholson Cir is a home located in Polk County.
Ownership History
Date
Name
Owned For
Owner Type
Purchase Details
Closed on
Oct 24, 2014
Sold by
Deal Clint A
Bought by
Deal Clint A and Deal Teresa L
Current Estimated Value
Purchase Details
Closed on
Feb 23, 2007
Sold by
Deal Clint A
Bought by
Deal Clint A
Purchase Details
Closed on
May 27, 1978
Bought by
Deal Clint A and Deal Juanita
Purchase Details
Closed on
Jan 2, 1963
Create a Home Valuation Report for This Property
The Home Valuation Report is an in-depth analysis detailing your home's value as well as a comparison with similar homes in the area
Home Values in the Area
Average Home Value in this Area
Purchase History
| Date | Buyer | Sale Price | Title Company |
|---|---|---|---|
| Deal Clint A | $16,500 | -- | |
| Deal Clint A | $5,000 | -- | |
| Deal Clint A | -- | -- | |
| -- | -- | -- |
Source: Public Records
Tax History Compared to Growth
Tax History
| Year | Tax Paid | Tax Assessment Tax Assessment Total Assessment is a certain percentage of the fair market value that is determined by local assessors to be the total taxable value of land and additions on the property. | Land | Improvement |
|---|---|---|---|---|
| 2025 | $411 | $24,350 | $2,750 | $21,600 |
| 2024 | $411 | $24,350 | $2,750 | $21,600 |
| 2023 | $411 | $24,350 | $0 | $0 |
| 2022 | $404 | $16,100 | $2,750 | $13,350 |
| 2021 | $404 | $16,100 | $2,750 | $13,350 |
| 2020 | $404 | $16,100 | $2,750 | $13,350 |
| 2019 | $404 | $16,100 | $2,750 | $13,350 |
| 2018 | $404 | $16,100 | $2,750 | $13,350 |
| 2017 | $387 | $15,325 | $2,375 | $12,950 |
| 2016 | $368 | $15,325 | $2,375 | $12,950 |
| 2015 | $368 | $15,325 | $2,375 | $12,950 |
| 2014 | $368 | $15,329 | $0 | $0 |
Source: Public Records
Map
Nearby Homes
- 3892 Highway 68
- 115 Blackhawk
- 140 Croft Chapel Rd
- 114 Blackhawk Ln
- 4245 Tennessee 68
- 130 Golden Eagle Cir
- 00 Stiles Rd
- 153 Vest Rd
- 119 Cantrell Ln
- 3970 Tennessee 68
- 283 Golden Eagle Cir
- 313 Golden Eagle Cir
- 198 Laurel Dr
- 133 Megan Trace Ln
- 00 Laurel Dr
- 954 Croft Chapel Rd
- Lot 20-B Sassafras Ridge Rd
- 0000 Kimsey Dairy Rd
- 00000 Kimsey Dairy Rd
- 240 McJunkin Rd
- 341 Nicholson Cir
- 327 Nicholson Cir
- 0 Croft Chapel Rd Hwy 68 Unit 20216532
- 391 Nicholson Cir
- 363 Nicholson Cir
- 396 Nicholson Cir
- 440 Nicholson Cir
- 375 Nicholson Cir
- 331 Nicholson Cir
- 452 Nicholson Cir
- 216 Nicholson Cir
- 443 Nicholson Cir
- 182 Long Dr
- 0 Nicholson Cir
- 462 Nicholson Cir
- 189 Nicholson Cir
- 350 Adcock Rd
- 168 Nicholson Cir
- 506 Nicholson Cir
- 150 Nicholson Cir