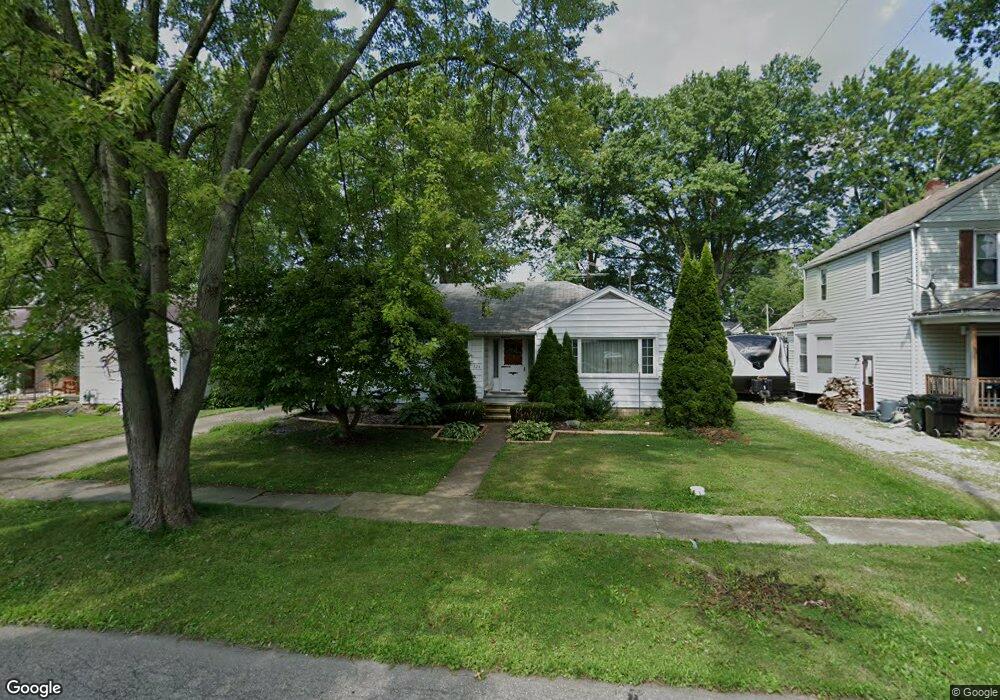
326 Olive St Elyria, OH 44035
Estimated Value: $136,542 - $180,000
3
Beds
1
Bath
1,243
Sq Ft
$128/Sq Ft
Est. Value
About This Home
This home is located at 326 Olive St, Elyria, OH 44035 and is currently estimated at $159,136, approximately $128 per square foot. 326 Olive St is a home located in Lorain County with nearby schools including Ely Elementary School, Northwood Middle School, and Elyria High School.
Ownership History
Date
Name
Owned For
Owner Type
Purchase Details
Closed on
Feb 23, 2024
Sold by
Feller Gary F and Feller Glenette R
Bought by
Feller Gary F and Feller Glenette R
Current Estimated Value
Purchase Details
Closed on
May 9, 2006
Sold by
Cebula Eileen J
Bought by
Feller Gary F and Huffman Glenette R
Home Financials for this Owner
Home Financials are based on the most recent Mortgage that was taken out on this home.
Original Mortgage
$95,900
Interest Rate
6.39%
Mortgage Type
Purchase Money Mortgage
Create a Home Valuation Report for This Property
The Home Valuation Report is an in-depth analysis detailing your home's value as well as a comparison with similar homes in the area
Home Values in the Area
Average Home Value in this Area
Purchase History
| Date | Buyer | Sale Price | Title Company |
|---|---|---|---|
| Feller Gary F | -- | None Listed On Document | |
| Feller Gary F | $119,900 | First American |
Source: Public Records
Mortgage History
| Date | Status | Borrower | Loan Amount |
|---|---|---|---|
| Previous Owner | Feller Gary F | $95,900 |
Source: Public Records
Tax History
| Year | Tax Paid | Tax Assessment Tax Assessment Total Assessment is a certain percentage of the fair market value that is determined by local assessors to be the total taxable value of land and additions on the property. | Land | Improvement |
|---|---|---|---|---|
| 2024 | $1,643 | $44,506 | $13,321 | $31,185 |
| 2023 | $1,472 | $36,194 | $9,475 | $26,719 |
| 2022 | $1,490 | $36,194 | $9,475 | $26,719 |
| 2021 | $1,493 | $36,194 | $9,475 | $26,719 |
| 2020 | $1,276 | $29,620 | $7,750 | $21,870 |
| 2019 | $1,268 | $29,620 | $7,750 | $21,870 |
| 2018 | $1,804 | $29,620 | $7,750 | $21,870 |
| 2017 | $1,924 | $30,270 | $7,820 | $22,450 |
| 2016 | $1,899 | $30,270 | $7,820 | $22,450 |
| 2015 | $1,826 | $30,270 | $7,820 | $22,450 |
| 2014 | $1,838 | $30,830 | $7,960 | $22,870 |
| 2013 | $1,823 | $30,830 | $7,960 | $22,870 |
Source: Public Records
Map
Nearby Homes
- 249 Roosevelt Ave
- 147 Bellfield Ave
- 235 Brandtson Ave
- 120 Longford Ave
- 144 Roosevelt Ave
- 127 Beebe Ave
- 463 Poplar St
- 141 Elma Dr
- 123 Harwood St
- 137 Lafayette St
- 147 Hamilton St
- 164 Woodbury St
- 297 Abbe Rd N
- 513 Gulf Rd
- 315 West Glen
- 118 Brandemere Ct
- 113 Coronado Ct
- 442 Hilliard Rd
- 409 Wesley Ave
- 347 Ohio St
Your Personal Tour Guide
Ask me questions while you tour the home.