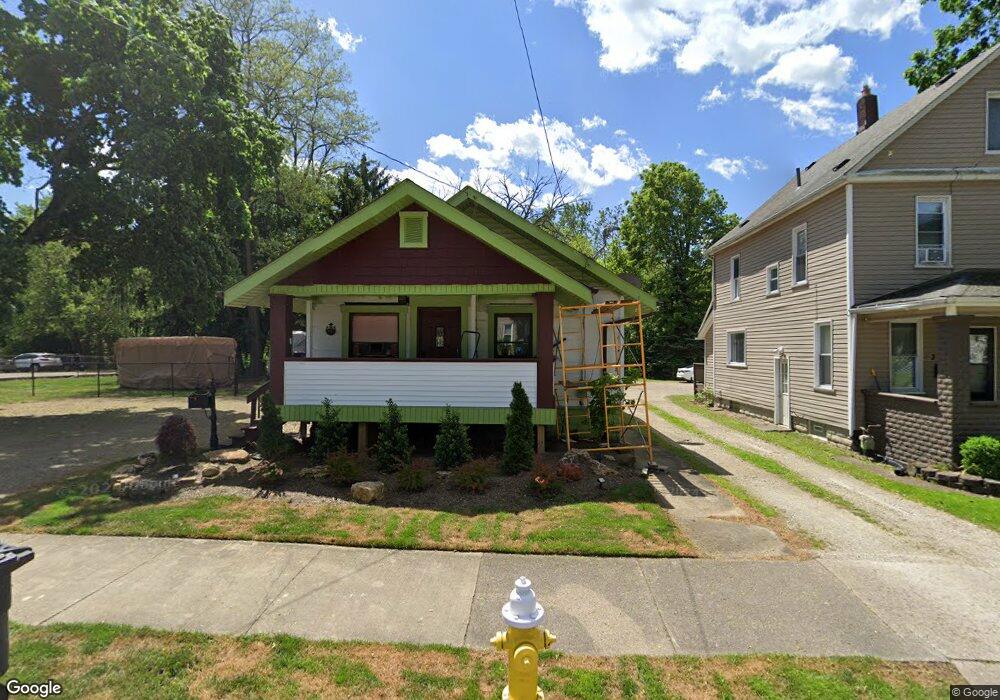
326 Power St Akron, OH 44311
Downtown Akron NeighborhoodEstimated Value: $84,000 - $96,000
3
Beds
1
Bath
1,120
Sq Ft
$81/Sq Ft
Est. Value
About This Home
This home is located at 326 Power St, Akron, OH 44311 and is currently estimated at $90,539, approximately $80 per square foot. 326 Power St is a home located in Summit County with nearby schools including North High School, Main Preparatory Academy, and Case Preparatory Academy.
Ownership History
Date
Name
Owned For
Owner Type
Purchase Details
Closed on
Feb 9, 2022
Sold by
Angheld Pamela M
Bought by
Angheld Richard A
Current Estimated Value
Purchase Details
Closed on
Nov 17, 2006
Sold by
Hall Frank R and Hall Joann M
Bought by
Angheld Richard A and Angheld Pamela M
Home Financials for this Owner
Home Financials are based on the most recent Mortgage that was taken out on this home.
Original Mortgage
$300,000
Interest Rate
6.36%
Mortgage Type
Credit Line Revolving
Create a Home Valuation Report for This Property
The Home Valuation Report is an in-depth analysis detailing your home's value as well as a comparison with similar homes in the area
Home Values in the Area
Average Home Value in this Area
Purchase History
| Date | Buyer | Sale Price | Title Company |
|---|---|---|---|
| Angheld Richard A | -- | Blum & Associates Co Lpa | |
| Angheld Richard A | $75,000 | Falls Title |
Source: Public Records
Mortgage History
| Date | Status | Borrower | Loan Amount |
|---|---|---|---|
| Previous Owner | Angheld Richard A | $300,000 |
Source: Public Records
Tax History
| Year | Tax Paid | Tax Assessment Tax Assessment Total Assessment is a certain percentage of the fair market value that is determined by local assessors to be the total taxable value of land and additions on the property. | Land | Improvement |
|---|---|---|---|---|
| 2025 | $3,516 | $29,306 | $8,197 | $21,109 |
| 2024 | $1,749 | $29,306 | $8,197 | $21,109 |
| 2023 | $3,516 | $29,306 | $8,197 | $21,109 |
| 2022 | $1,533 | $19,821 | $5,429 | $14,392 |
| 2021 | $1,694 | $19,821 | $5,429 | $14,392 |
| 2020 | $1,673 | $19,820 | $5,430 | $14,390 |
| 2019 | $1,985 | $22,300 | $8,510 | $13,790 |
| 2018 | $1,963 | $22,300 | $8,510 | $13,790 |
| 2017 | $1,398 | $19,990 | $6,200 | $13,790 |
| 2016 | $1,399 | $17,790 | $6,200 | $11,590 |
| 2015 | $1,398 | $17,790 | $6,200 | $11,590 |
| 2014 | $1,388 | $17,790 | $6,200 | $11,590 |
| 2013 | $1,742 | $19,530 | $6,200 | $13,330 |
Source: Public Records
Map
Nearby Homes
- 531 Allyn St Unit 533
- 450 Allyn St
- 429 Brown St
- 399 Crouse St
- 403 Crouse St
- 444 Sumner St
- 481 Sherman St
- 429 Lovisa St
- 653 Sumner St
- 498 Gage St
- 658 Sumner St Unit 662
- 673 Sumner St
- 678 Sumner St Unit 682
- 508 Crouse St
- 675 Sherman St
- 634 Spicer St
- 301 E Voris St
- 718 Allyn St
- 620 Hedden Ave
- 756 Brown St
Your Personal Tour Guide
Ask me questions while you tour the home.