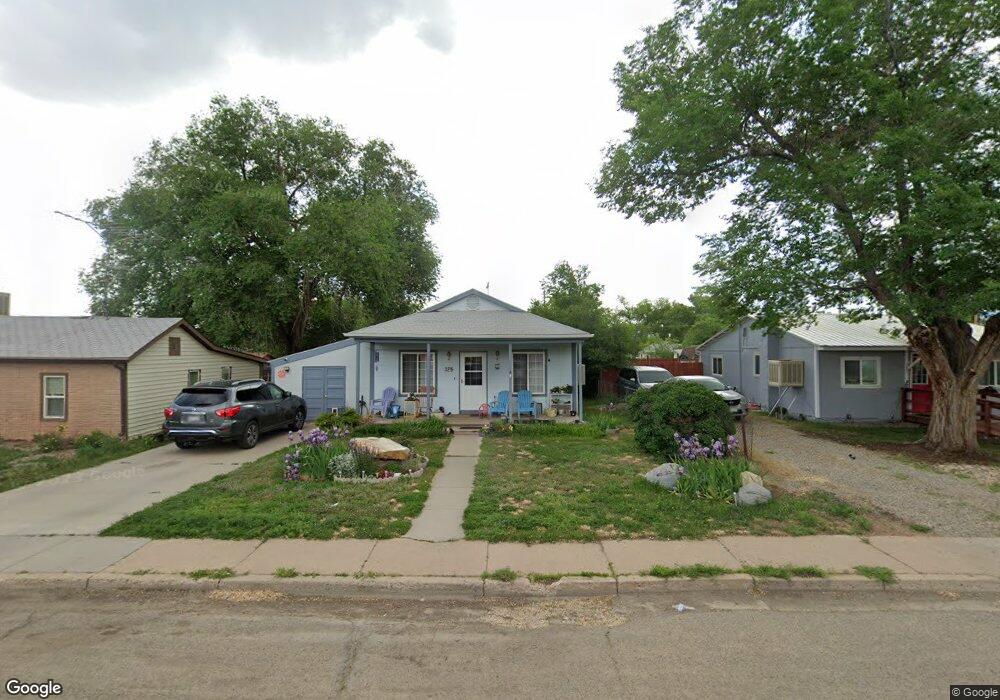
326 S Maple St Cortez, CO 81321
Estimated Value: $225,000 - $256,584
3
Beds
1
Bath
1,008
Sq Ft
$234/Sq Ft
Est. Value
About This Home
This home is located at 326 S Maple St, Cortez, CO 81321 and is currently estimated at $236,146, approximately $234 per square foot. 326 S Maple St is a home located in Montezuma County with nearby schools including Montezuma-Cortez High School, Children's Kiva Montessori School, and Children's Kiva Montessori Preschool & Kindergarten.
Ownership History
Date
Name
Owned For
Owner Type
Purchase Details
Closed on
May 13, 2011
Sold by
Myers Richard L
Bought by
Burnison Michael S
Current Estimated Value
Home Financials for this Owner
Home Financials are based on the most recent Mortgage that was taken out on this home.
Original Mortgage
$107,211
Outstanding Balance
$76,595
Interest Rate
5.5%
Mortgage Type
FHA
Estimated Equity
$159,551
Purchase Details
Closed on
Sep 20, 2006
Sold by
Lente Melodie A
Bought by
Myers Richard L
Home Financials for this Owner
Home Financials are based on the most recent Mortgage that was taken out on this home.
Original Mortgage
$134,500
Interest Rate
6.55%
Mortgage Type
USDA
Purchase Details
Closed on
May 25, 2001
Sold by
Dunphy Daniel B
Bought by
Lente Melodie A
Purchase Details
Closed on
May 1, 1996
Sold by
Wallace Clifford R
Bought by
Dunphy Daniel B
Purchase Details
Closed on
May 19, 1994
Sold by
Mckinney Sidney J & The
Bought by
Wallace Clifford R
Create a Home Valuation Report for This Property
The Home Valuation Report is an in-depth analysis detailing your home's value as well as a comparison with similar homes in the area
Purchase History
| Date | Buyer | Sale Price | Title Company |
|---|---|---|---|
| Burnison Michael S | $110,000 | Colorado Land Title Co Llc | |
| Myers Richard L | $134,500 | Colorado Land Title Co | |
| Lente Melodie A | $91,000 | -- | |
| Dunphy Daniel B | $75,000 | -- | |
| Wallace Clifford R | $9,000 | -- |
Source: Public Records
Mortgage History
| Date | Status | Borrower | Loan Amount |
|---|---|---|---|
| Open | Burnison Michael S | $107,211 | |
| Previous Owner | Myers Richard L | $134,500 |
Source: Public Records
Tax History
| Year | Tax Paid | Tax Assessment Tax Assessment Total Assessment is a certain percentage of the fair market value that is determined by local assessors to be the total taxable value of land and additions on the property. | Land | Improvement |
|---|---|---|---|---|
| 2024 | $929 | $11,595 | $1,797 | $9,798 |
| 2023 | $596 | $15,973 | $2,475 | $13,498 |
| 2022 | $518 | $10,714 | $1,130 | $9,584 |
| 2021 | $527 | $10,714 | $1,130 | $9,584 |
| 2020 | $475 | $10,031 | $1,243 | $8,788 |
| 2019 | $476 | $10,031 | $1,243 | $8,788 |
| 2018 | $593 | $9,310 | $1,120 | $8,190 |
| 2017 | $590 | $9,310 | $1,120 | $8,190 |
| 2016 | $509 | $8,860 | $1,240 | $7,620 |
| 2015 | $467 | $129,060 | $0 | $0 |
| 2014 | $544 | $8,860 | $0 | $0 |
Source: Public Records
Map
Nearby Homes
- 420 W 4th St
- 210 W 3rd St Unit 4
- 317 S Chestnut St
- 209 S Chestnut St
- 520 W 6th St Unit 15
- 501 S Market St
- 144 S Market St
- 500 S Market St
- 313 S Broadway
- 706 S Cedar St
- 431 Juniper Place
- 526 Juniper Place
- 511 Juniper Place
- 530 Juniper Place
- 821 S Chestnut St
- 122 E 1st St Unit see broker remarks
- 770 Stratton Dr
- 16 W 10th St
- 608 Alameda Dr
- Tract 9 N Broadway
- 320 S Maple St
- 334 S Maple St
- 314 S Maple St
- 346 S Maple St
- 333 S Linden St
- 300 S Maple St
- 307 W 3rd St
- 335 S Linden St
- 339 S Linden St
- 331 S Maple St
- 307 S Linden St
- 347 S Maple St
- 347 S Linden St
- TBD W 3rd St
- 325 S Maple St
- 400 S Maple St
- 311 S Maple St
- S Maple Unit 407 S Maple
- S Maple
- 301 S Maple St
Your Personal Tour Guide
Ask me questions while you tour the home.