NOT LISTED FOR SALE

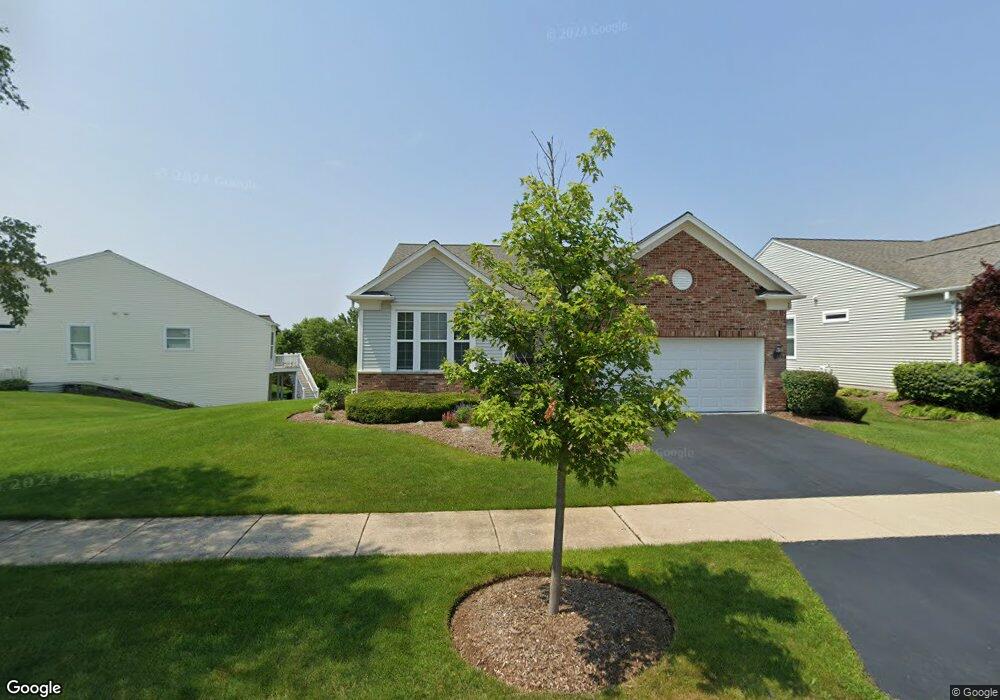
Estimated Value: $564,000 - $735,000

3 Beds
3 Baths
1,911 Sq Ft
$325/Sq Ft Est. Value

Last Sold March 26, 2018

Last sale price $375,000 $196 Per Sq Ft

Est. 66% increase in value since last sale

Current estimated payment $4,608/month

About This Home

Sold during private listing status.

Ownership History

Date Name Owned For Owner Type

Purchase Details

Listed on
Jan 23, 2018
Closed on
Mar 9, 2018
Sold by
Mcdonald Swan Martin D and Mcdonald Swan Martha E
Bought by
Munson Kenneth Earl and Munson Trust
Seller's Agent
Helen Oliveri
Helen Oliveri Real Estate
Buyer's Agent
Robert 'Bob' Naughtrip
Coldwell Banker Realty
List Price
$385,000
Sold Price
$375,000
Premium/Discount to List
-$10,000
-2.6%
Current Estimated Value
$621,405

Home Financials for this Owner

Home Financials are based on the most recent Mortgage that was taken out on this home.
Estimated Appreciation
$246,405
Avg. Annual Appreciation
6.87%

Purchase Details

Closed on
Aug 13, 2007
Sold by
Pulte Home Corp
Bought by
Swan Martin D and Mcdonald Swan Martha E

Home Financials for this Owner

Home Financials are based on the most recent Mortgage that was taken out on this home.
Original Mortgage
$326,632
Interest Rate
6.77%
Mortgage Type
Purchase Money Mortgage
Source: Public Records

Range of Values:

Collateral Analytics

Collateral Analytics Collateral Analytics AVMs (Automated Valuation Model) employ a number of statistical approaches combined with neighborhood-specific comparable selection guarantees the most up-to-date and precise valuations.

Not Available

Collateral Analytics does not have data for the current month. Please view the chart for historical values.

ICE

ICE Mortgage Technology ICE Mortgage Technology’s AVM (Automated Valuation Model) is a state-of-the-art online residential property valuation tool that provides a quick and accurate estimate of the value of almost any home in the U.S.

Not Available

ICE Mortgage Technology does not have data for the current month. Please view the chart for historical values.

First American

First American First American Data & Analytics’ next-generation AVM combines unrivaled data assets with a blended ensemble of valuation models to produce highly accurate, reliable valuations you can trust.

Not Available

First American does not have data for the current month. Please view the chart for historical values.

Quantarium

Quantarium Quantarium’s valuation service, repeatedly proven the industry’s most accurate and comprehensive, is supercharged with a self-learning and auto-tuning AI engine that continually becomes smarter and more accurate as it processes daily inputs from the industry’s leading RE data lake.

Not Available

Quantarium does not have data for the current month. Please view the chart for historical values.

Average Value
Not Available
List Price
Sold Price
Create a Home Valuation Report for This Property
The Home Valuation Report is an in-depth analysis detailing your home's value as well as a comparison with similar homes in the area

Home Values in the Area

Source: Public Records

Average Home Value in this Area


Source: Public Records

Purchase History

Date Buyer Sale Price Title Company
Munson Kenneth Earl $375,000 Attorneys Title Guaranty Fun
Swan Martin D $408,500 Pulte Midwest Title South
Source: Public Records

Mortgage History

Date Status Borrower Loan Amount
Previous Owner Swan Martin D $326,632
Source: Public Records

Property History

Date Event Price List to Sale Price per Sq Ft Prior Sale
03/26/2018 03/26/18 Sold $375,000 -2.6% $196 / Sq Ft View Prior Sale
01/23/2018 01/23/18 Pending -- -- --
01/23/2018 01/23/18 For Sale $385,000 -- $201 / Sq Ft

Tax History Compared to Growth

Source: Public Records

Tax History

Year Tax Paid Tax Assessment Tax Assessment Total Assessment is a certain percentage of the fair market value that is determined by local assessors to be the total taxable value of land and additions on the property. Land Improvement
2024 $13,548 $167,318 $44,183 $123,135
2023 $13,034 $148,841 $39,304 $109,537
2022 $13,034 $142,069 $40,033 $102,036
2021 $12,482 $137,093 $38,631 $98,462
2020 $12,535 $133,320 $37,568 $95,752
2019 $13,331 $141,693 $36,333 $105,360
2018 $10,983 $124,988 $34,528 $90,460
2017 $11,242 $128,985 $33,441 $95,544
2016 $10,967 $122,505 $31,761 $90,744
2015 $10,743 $114,845 $29,775 $85,070
2014 $10,736 $110,187 $28,338 $81,849
2012 $10,383 $111,166 $28,590 $82,576
Source: Public Records

Agents Affiliated with this Home

  • Section Image
  • Section Image
See All Agents

Map