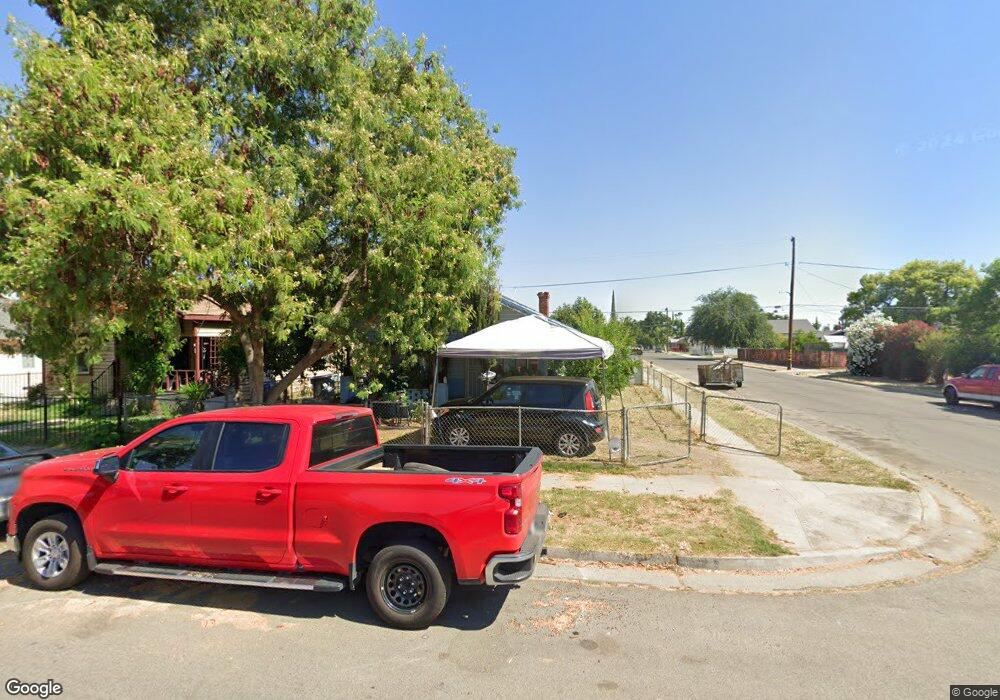
3261 E Illinois Ave Fresno, CA 93702
Huntington NeighborhoodEstimated Value: $223,566 - $264,000
2
Beds
2
Baths
888
Sq Ft
$277/Sq Ft
Est. Value
About This Home
This home is located at 3261 E Illinois Ave, Fresno, CA 93702 and is currently estimated at $245,892, approximately $276 per square foot. 3261 E Illinois Ave is a home located in Fresno County with nearby schools including Rowell Elementary School, Yosemite Middle School, and Mclane High School.
Ownership History
Date
Name
Owned For
Owner Type
Purchase Details
Closed on
Apr 29, 2009
Sold by
Mejia Maria Elizabeth
Bought by
Jhs Family Limited Partnership
Current Estimated Value
Purchase Details
Closed on
Sep 20, 2007
Sold by
Mejia Maria Elizabeth
Bought by
Mejia Maria Elizabeth and Mejia Baldomero
Purchase Details
Closed on
Dec 15, 2005
Sold by
Gonzalez Lucilo
Bought by
Mejia Maria Elizabeth
Home Financials for this Owner
Home Financials are based on the most recent Mortgage that was taken out on this home.
Original Mortgage
$75,100
Interest Rate
7.5%
Mortgage Type
New Conventional
Purchase Details
Closed on
May 25, 2005
Sold by
Gonzalez Elizabeth
Bought by
Gonzalez Lucilo
Purchase Details
Closed on
Oct 28, 2003
Sold by
Gonzalez Lucilo
Bought by
Gonzalez Elizabeth
Create a Home Valuation Report for This Property
The Home Valuation Report is an in-depth analysis detailing your home's value as well as a comparison with similar homes in the area
Home Values in the Area
Average Home Value in this Area
Purchase History
| Date | Buyer | Sale Price | Title Company |
|---|---|---|---|
| Jhs Family Limited Partnership | $40,300 | None Available | |
| Mejia Maria Elizabeth | -- | Accommodation | |
| Mejia Maria Elizabeth | $200,000 | Financial Title Company | |
| Gonzalez Lucilo | -- | Financial Title Company | |
| Gonzalez Lucilo | -- | -- | |
| Gonzalez Elizabeth | -- | -- |
Source: Public Records
Mortgage History
| Date | Status | Borrower | Loan Amount |
|---|---|---|---|
| Previous Owner | Mejia Maria Elizabeth | $75,100 |
Source: Public Records
Tax History Compared to Growth
Tax History
| Year | Tax Paid | Tax Assessment Tax Assessment Total Assessment is a certain percentage of the fair market value that is determined by local assessors to be the total taxable value of land and additions on the property. | Land | Improvement |
|---|---|---|---|---|
| 2025 | $671 | $51,880 | $25,746 | $26,134 |
| 2023 | $658 | $49,868 | $24,748 | $25,120 |
| 2022 | $649 | $48,891 | $24,263 | $24,628 |
| 2021 | $632 | $47,934 | $23,788 | $24,146 |
| 2020 | $629 | $47,444 | $23,545 | $23,899 |
| 2019 | $606 | $46,515 | $23,084 | $23,431 |
| 2018 | $593 | $45,604 | $22,632 | $22,972 |
| 2017 | $583 | $44,711 | $22,189 | $22,522 |
| 2016 | $565 | $43,835 | $21,754 | $22,081 |
| 2015 | $556 | $43,178 | $21,428 | $21,750 |
| 2014 | $544 | $42,333 | $21,009 | $21,324 |
Source: Public Records
Map
Nearby Homes
- 3349 E Platt Ave
- 3051 E Mckenzie Ave
- 3040 E Washington Ave
- 3223 E Madison Ave
- 2966 E Illinois Ave
- 3427 E Madison Ave
- 408 N Orchard St
- 3634 E Madison Ave
- 558 N Bond St
- 3021 E Belmont Ave
- 535 N 5th St
- 3764 E Iowa Ave
- 607 N 4th St
- 3023 E White Ave
- 2726 E Washington Ave
- 3803 E Madison Ave
- 244 N U St
- 3728 E Huntington Blvd
- 3436 E Mono St
- 2909 Huntington Blvd Unit 133
- 3255 E Illinois Ave
- 3245 E Illinois Ave
- 3305 E Illinois Ave
- 3239 E Illinois Ave
- 3306 E Nevada Ave
- 3260 E Illinois Ave
- 3233 E Illinois Ave
- 3258 E Illinois Ave
- 3244 E Nevada Ave
- 3254 E Illinois Ave
- 3310 E Illinois Ave
- 3321 E Illinois Ave Unit 101-2
- 3321 E Illinois Ave
- 3312 E Nevada Ave
- 3246 E Illinois Ave
- 3227 E Illinois Ave
- 3232 E Nevada Ave
- 3318 E Illinois Ave
- 3318 E Nevada Ave
- 3221 E Illinois Ave