3261 E Shawnee Ave Des Moines, IA 50317
Douglas Acres NeighborhoodEstimated Value: $225,000 - $257,477
3
Beds
1
Bath
1,008
Sq Ft
$239/Sq Ft
Est. Value
About This Home
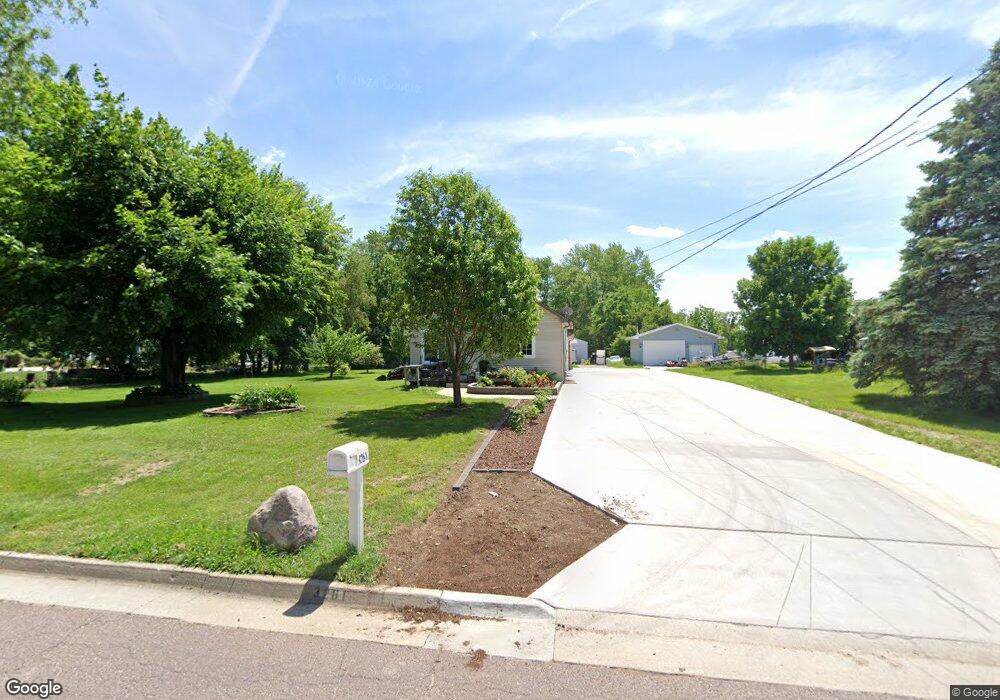
This home is located at 3261 E Shawnee Ave, Des Moines, IA 50317 and is currently estimated at $240,619, approximately $238 per square foot. 3261 E Shawnee Ave is a home located in Polk County with nearby schools including Garton Elementary School, Goodrell Middle School, and North High School.
Ownership History
Date
Name
Owned For
Owner Type
Purchase Details
Closed on
Nov 19, 2013
Sold by
Berber Hernandez Horacio
Bought by
Marquez Rosa
Current Estimated Value
Purchase Details
Closed on
Mar 25, 2011
Sold by
Ruiz Armando and Medina Arnulfa
Bought by
Berber Hernandez Horacio and Maequez Rosa
Home Financials for this Owner
Home Financials are based on the most recent Mortgage that was taken out on this home.
Original Mortgage
$47,000
Interest Rate
4.3%
Mortgage Type
New Conventional
Purchase Details
Closed on
Nov 19, 2008
Sold by
Senecaut Richard L and Senecaut Janet
Bought by
Ruiz Armando and Berber Hernandez Horacio
Home Financials for this Owner
Home Financials are based on the most recent Mortgage that was taken out on this home.
Original Mortgage
$63,400
Interest Rate
6%
Mortgage Type
Purchase Money Mortgage
Create a Home Valuation Report for This Property
The Home Valuation Report is an in-depth analysis detailing your home's value as well as a comparison with similar homes in the area
Home Values in the Area
Average Home Value in this Area
Purchase History
| Date | Buyer | Sale Price | Title Company |
|---|---|---|---|
| Marquez Rosa | -- | None Available | |
| Berber Hernandez Horacio | -- | Itc | |
| Ruiz Armando | $70,000 | None Available |
Source: Public Records
Mortgage History
| Date | Status | Borrower | Loan Amount |
|---|---|---|---|
| Previous Owner | Berber Hernandez Horacio | $47,000 | |
| Previous Owner | Ruiz Armando | $63,400 |
Source: Public Records
Tax History Compared to Growth
Tax History
| Year | Tax Paid | Tax Assessment Tax Assessment Total Assessment is a certain percentage of the fair market value that is determined by local assessors to be the total taxable value of land and additions on the property. | Land | Improvement |
|---|---|---|---|---|
| 2025 | $3,380 | $249,900 | $48,200 | $201,700 |
| 2024 | $3,380 | $182,300 | $44,200 | $138,100 |
| 2023 | $2,966 | $233,000 | $44,200 | $188,800 |
| 2022 | $2,940 | $185,400 | $38,900 | $146,500 |
| 2021 | $2,802 | $185,400 | $38,900 | $146,500 |
| 2020 | $2,906 | $171,600 | $35,800 | $135,800 |
| 2019 | $2,454 | $171,600 | $35,800 | $135,800 |
| 2018 | $3,024 | $150,500 | $30,500 | $120,000 |
| 2017 | $2,390 | $122,400 | $30,500 | $91,900 |
| 2016 | $2,324 | $96,900 | $27,600 | $69,300 |
| 2015 | $2,324 | $96,900 | $27,600 | $69,300 |
| 2014 | $2,104 | $87,900 | $24,600 | $63,300 |
Source: Public Records
Map
Nearby Homes
- 4029 Colfax Ave
- 4140 E 30th St
- 4326 NE 35th St
- 3520 E 32nd St
- 3500 E 32nd St
- 3001 E Ovid Ave
- 1408 E 38th St
- 000 E 38th St
- 2822 Wedgewood Rd
- 3512 NE 46th Ave
- 2776 NE Norwood Ln
- 4763 NE 33rd Ct
- 3708 E 39th St
- 2704 Wedgewood Rd
- 3902 E 40th St
- 4300 NE 27th St
- 3005 Don Lee Ct
- 3001 Don Lee Ct
- 2519 E Aurora Ave
- 3606 E 39th Ct
- 3255 E Shawnee Ave
- 3275 E Shawnee Ave
- 3256 E Shawnee Ave
- 3301 E Shawnee Ave
- 3270 E Shawnee Ave
- 3266 E Shawnee Ave
- 3235 E Shawnee Ave
- 3300 E Shawnee Ave
- 3311 E Shawnee Ave
- 3234 E Shawnee Ave
- 3248 E Shawnee Ave
- 3317 E Shawnee Ave
- 3230 E Shawnee Ave
- 3227 E Shawnee Ave
- 3321 E Shawnee Ave
- 3224 E Shawnee Ave
- 3316 E Shawnee Ave
- 3219 E Shawnee Ave
- 3320 E Shawnee Ave
- 3327 E Shawnee Ave