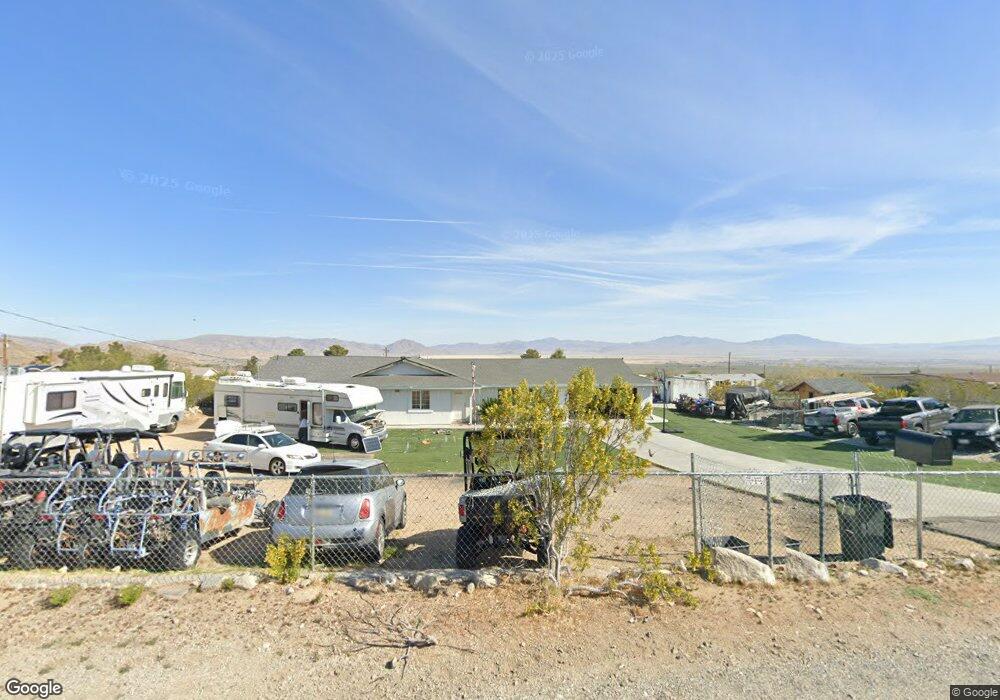
32646 Carnelian Rd Lucerne Valley, CA 92356
Estimated Value: $303,561 - $414,000
3
Beds
2
Baths
1,344
Sq Ft
$263/Sq Ft
Est. Value
About This Home
This home is located at 32646 Carnelian Rd, Lucerne Valley, CA 92356 and is currently estimated at $354,140, approximately $263 per square foot. 32646 Carnelian Rd is a home located in San Bernardino County with nearby schools including Lucerne Valley Elementary School, Lucerne Valley Middle School, and Lucerne Valley High School.
Ownership History
Date
Name
Owned For
Owner Type
Purchase Details
Closed on
Mar 15, 2006
Sold by
Apple Creek Homes Inc
Bought by
Salem Summer
Current Estimated Value
Home Financials for this Owner
Home Financials are based on the most recent Mortgage that was taken out on this home.
Original Mortgage
$172,000
Outstanding Balance
$143,314
Interest Rate
7.77%
Mortgage Type
Purchase Money Mortgage
Estimated Equity
$210,826
Purchase Details
Closed on
Mar 2, 2006
Sold by
Garibay Garcia Miguel Angel
Bought by
Salem Summer
Home Financials for this Owner
Home Financials are based on the most recent Mortgage that was taken out on this home.
Original Mortgage
$172,000
Outstanding Balance
$143,314
Interest Rate
7.77%
Mortgage Type
Purchase Money Mortgage
Estimated Equity
$210,826
Purchase Details
Closed on
Mar 8, 2005
Sold by
Annesley Shannon J
Bought by
Apple Creek Homes Inc
Purchase Details
Closed on
Mar 11, 2003
Sold by
Whiteside Gina Marie
Bought by
Annesley Shannon J and Shannon J Annesley Living Fami
Purchase Details
Closed on
Oct 29, 1999
Sold by
Annesley Shannon J Tr
Bought by
Whiteside Gina Marie
Create a Home Valuation Report for This Property
The Home Valuation Report is an in-depth analysis detailing your home's value as well as a comparison with similar homes in the area
Home Values in the Area
Average Home Value in this Area
Purchase History
| Date | Buyer | Sale Price | Title Company |
|---|---|---|---|
| Salem Summer | $215,000 | First American Title Company | |
| Salem Summer | -- | First American Title Company | |
| Apple Creek Homes Inc | $33,000 | First American | |
| Annesley Shannon J | -- | -- | |
| Whiteside Gina Marie | -- | First American Title |
Source: Public Records
Mortgage History
| Date | Status | Borrower | Loan Amount |
|---|---|---|---|
| Open | Salem Summer | $172,000 | |
| Closed | Salem Summer | $43,000 |
Source: Public Records
Tax History Compared to Growth
Tax History
| Year | Tax Paid | Tax Assessment Tax Assessment Total Assessment is a certain percentage of the fair market value that is determined by local assessors to be the total taxable value of land and additions on the property. | Land | Improvement |
|---|---|---|---|---|
| 2025 | $3,373 | $293,816 | $81,995 | $211,821 |
| 2024 | $3,373 | $288,055 | $80,387 | $207,668 |
| 2023 | $3,331 | $282,407 | $78,811 | $203,596 |
| 2022 | $3,253 | $276,870 | $77,266 | $199,604 |
| 2021 | $2,832 | $241,000 | $48,000 | $193,000 |
| 2020 | $2,290 | $192,400 | $38,500 | $153,900 |
| 2019 | $2,206 | $185,000 | $37,000 | $148,000 |
| 2018 | $1,700 | $153,200 | $30,300 | $122,900 |
| 2017 | $1,585 | $142,500 | $28,200 | $114,300 |
| 2016 | $1,465 | $131,900 | $26,100 | $105,800 |
| 2015 | $1,355 | $121,600 | $24,100 | $97,500 |
| 2014 | $1,240 | $110,500 | $21,900 | $88,600 |
Source: Public Records
Map
Nearby Homes
- 32758 Spinel Rd
- 32786 Topaz Rd
- 0 No Name Unit IV24187306
- 32816 Topaz Rd
- 503 Spinel Rd
- 7980 Crystal Creek Rd
- 32358 Emerald Rd
- 0 Amber Rd Unit HD25141116
- 721 Zircon Rd
- 32042 Zircon Rd
- 32252 Emerald Rd
- 32224 Emerald Rd
- 32161 Zircon Rd
- 0 Carnelian Rd Unit HD25149897
- 7543 Mesa Rd
- 0 Randell St
- 0 Silver Creek
- 0 Crystal Creek Rd Unit HD25006472
- 9125 Mesa Rd
- 9210 Mesa Rd
- 32672 Carnelian Rd
- 32644 Carnelian Rd
- 32649 Topaz Rd
- 32669 Carnelian Rd
- 32625 Carnelian Rd
- 32698 Carnelian Rd
- 32611 Topaz Rd
- 32697 Carnelian Rd
- 32603 Carnelian Rd
- 32720 Carnelian Rd
- 32668 Spinel Rd
- 32628 Topaz Rd
- 32573 Topaz Rd
- 32727 Carnelian Rd
- 32595 Carnelian Rd
- 32696 Spinel Rd
- 32600 Spinel Rd
- 32612 Topaz Rd
- 32560 Carnelian Rd
- 32726 Spinel Rd