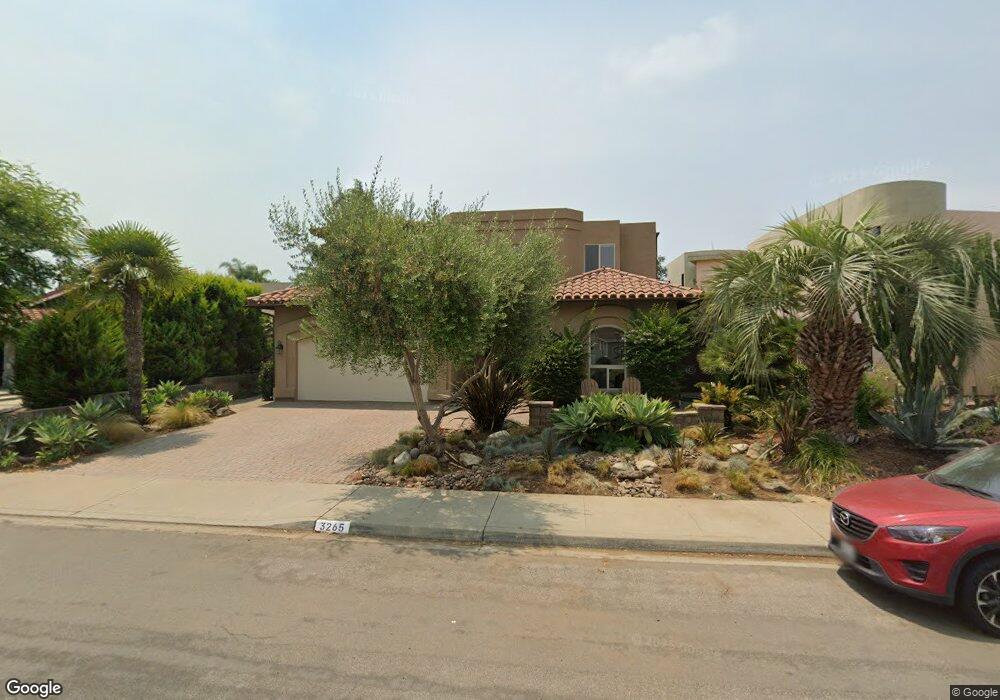
3265 James Dr Carlsbad, CA 92008
Olde Carlsbad NeighborhoodEstimated Value: $2,346,117 - $2,977,000
5
Beds
3
Baths
3,935
Sq Ft
$686/Sq Ft
Est. Value
About This Home
This home is located at 3265 James Dr, Carlsbad, CA 92008 and is currently estimated at $2,700,529, approximately $686 per square foot. 3265 James Dr is a home located in San Diego County with nearby schools including Magnolia Elementary, Carlsbad High School, and Sage Creek High.
Ownership History
Date
Name
Owned For
Owner Type
Purchase Details
Closed on
Jan 22, 2013
Sold by
Genewich Michael and Genewich Melissa Sue Kristine
Bought by
Genewich Michael and Genewich Melissa Sue Kristine
Current Estimated Value
Home Financials for this Owner
Home Financials are based on the most recent Mortgage that was taken out on this home.
Original Mortgage
$518,000
Outstanding Balance
$94,566
Interest Rate
2.63%
Mortgage Type
New Conventional
Estimated Equity
$2,605,963
Purchase Details
Closed on
Jun 19, 2012
Sold by
Genewich Michael and Genewich Melissa Sue Kristine
Bought by
Genewich Michael and Genewich Melissa Sue Kristine
Home Financials for this Owner
Home Financials are based on the most recent Mortgage that was taken out on this home.
Original Mortgage
$530,000
Interest Rate
2.99%
Mortgage Type
New Conventional
Purchase Details
Closed on
May 19, 2010
Sold by
Kipley Peter C and Kipley Peter
Bought by
Genewich Michael and Genewich Melissa Sue Kristine
Home Financials for this Owner
Home Financials are based on the most recent Mortgage that was taken out on this home.
Original Mortgage
$570,000
Interest Rate
5.03%
Mortgage Type
New Conventional
Purchase Details
Closed on
Oct 25, 2007
Sold by
Kipley Karyn
Bought by
Kipley Peter
Home Financials for this Owner
Home Financials are based on the most recent Mortgage that was taken out on this home.
Original Mortgage
$980,000
Interest Rate
6.05%
Mortgage Type
Purchase Money Mortgage
Purchase Details
Closed on
Sep 27, 2007
Sold by
Moore Thomas G and Moore Helen M
Bought by
Kipley Peter C
Home Financials for this Owner
Home Financials are based on the most recent Mortgage that was taken out on this home.
Original Mortgage
$980,000
Interest Rate
6.05%
Mortgage Type
Purchase Money Mortgage
Purchase Details
Closed on
Oct 10, 2005
Sold by
Moore Thomas G and Moore Helen Martin
Bought by
Moore Thomas G and Moore Helen M
Purchase Details
Closed on
May 15, 2000
Sold by
Thomas Benacka
Bought by
Moore Thomas G and Moore Helen Martin
Home Financials for this Owner
Home Financials are based on the most recent Mortgage that was taken out on this home.
Original Mortgage
$133,000
Interest Rate
8.22%
Mortgage Type
Seller Take Back
Create a Home Valuation Report for This Property
The Home Valuation Report is an in-depth analysis detailing your home's value as well as a comparison with similar homes in the area
Home Values in the Area
Average Home Value in this Area
Purchase History
| Date | Buyer | Sale Price | Title Company |
|---|---|---|---|
| Genewich Michael | -- | Ticor Title Company Of Ca | |
| Genewich Michael | -- | Ticor Title Company Of Ca | |
| Genewich Michael | -- | Accommodation | |
| Genewich Michael | -- | Ticor Title Company Of Ca | |
| Genewich Michael | $950,000 | Lawyers Title | |
| Kipley Peter | -- | California Title Company | |
| Kipley Peter C | $1,260,000 | California Title Company | |
| Moore Thomas G | -- | -- | |
| Moore Thomas G | $175,000 | First American Title |
Source: Public Records
Mortgage History
| Date | Status | Borrower | Loan Amount |
|---|---|---|---|
| Open | Genewich Michael | $518,000 | |
| Closed | Genewich Michael | $530,000 | |
| Closed | Genewich Michael | $570,000 | |
| Previous Owner | Kipley Peter C | $980,000 | |
| Previous Owner | Moore Thomas G | $133,000 |
Source: Public Records
Tax History
| Year | Tax Paid | Tax Assessment Tax Assessment Total Assessment is a certain percentage of the fair market value that is determined by local assessors to be the total taxable value of land and additions on the property. | Land | Improvement |
|---|---|---|---|---|
| 2025 | $12,802 | $1,226,257 | $622,164 | $604,093 |
| 2024 | $12,802 | $1,202,214 | $609,965 | $592,249 |
| 2023 | $12,736 | $1,178,642 | $598,005 | $580,637 |
| 2022 | $12,539 | $1,155,532 | $586,280 | $569,252 |
| 2021 | $12,444 | $1,132,876 | $574,785 | $558,091 |
| 2020 | $12,359 | $1,121,261 | $568,892 | $552,369 |
| 2019 | $12,135 | $1,099,277 | $557,738 | $541,539 |
| 2018 | $11,621 | $1,077,723 | $546,802 | $530,921 |
| 2017 | $11,428 | $1,056,592 | $536,081 | $520,511 |
| 2016 | $10,968 | $1,035,875 | $525,570 | $510,305 |
| 2015 | $10,923 | $1,020,316 | $517,676 | $502,640 |
| 2014 | $10,739 | $1,000,330 | $507,536 | $492,794 |
Source: Public Records
Map
Nearby Homes
- 2038 Avenue of The Trees
- 3747 Adams St
- 3354 Seacrest Dr
- 3630 Donna Dr
- 3235 Donna Dr
- 2725 Morning Glory Ln
- 965 Home Ave
- 3736 Donna Ct
- 2829 Forest View Way
- 2645 Highland Dr
- 737 Pine Ave
- 800 Grand Ave Unit 105
- 735 Pine Ave
- 3880 Adams St
- 1199 Tamarack Ave
- 880 Home Ave Unit G
- 725 Grand Ave
- 4332 Adams St
- 4340 Adams St
- 3379 Roosevelt St
- 3255 James Dr
- 3285 James Dr
- 3245 James Dr
- 3307 James Dr
- 3303 James Dr
- 3229 James Dr
- 1625 Saint James Ct
- 3264 Highland Dr
- 3252 Highland Dr
- 0 James Dr
- 3236 Highland Dr
- 3286 James Dr
- 3276 Highland Dr
- 3315 James Dr
- 3219 James Dr
- 3308 James Dr
- 3286 Highland Dr
- 1620 Saint James Ct
- 3311 James Dr
- 3226 Highland Dr Unit 34
Your Personal Tour Guide
Ask me questions while you tour the home.