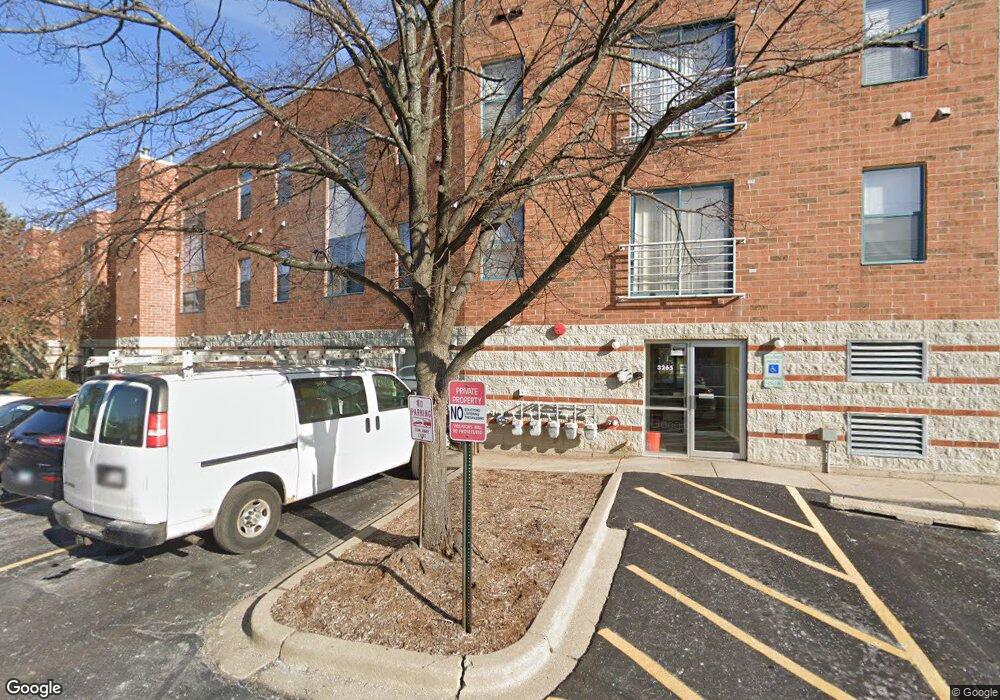
3265 Kirchoff Rd Unit 229 Rolling Meadows, IL 60008
Estimated Value: $176,140 - $202,000
2
Beds
--
Bath
1,156
Sq Ft
$166/Sq Ft
Est. Value
About This Home
This home is located at 3265 Kirchoff Rd Unit 229, Rolling Meadows, IL 60008 and is currently estimated at $192,035, approximately $166 per square foot. 3265 Kirchoff Rd Unit 229 is a home located in Cook County with nearby schools including Kimball Hill Elementary School, Carl Sandburg Junior High School, and Rolling Meadows High School.
Ownership History
Date
Name
Owned For
Owner Type
Purchase Details
Closed on
Mar 3, 2010
Sold by
Schulman Allan
Bought by
Schulman Allan and Schulman Nelum
Current Estimated Value
Purchase Details
Closed on
Oct 28, 2009
Sold by
Cohen Steven M and Cohen Sharon R
Bought by
Schulman Allan
Home Financials for this Owner
Home Financials are based on the most recent Mortgage that was taken out on this home.
Original Mortgage
$97,680
Outstanding Balance
$64,139
Interest Rate
5.11%
Mortgage Type
FHA
Estimated Equity
$127,896
Purchase Details
Closed on
Nov 10, 2004
Sold by
Cohen Steven M and Cohen Sharon R
Bought by
Cohen Steven M and Cohen Sharon R
Purchase Details
Closed on
Jan 24, 2004
Sold by
Wechman Pamela L and Wechman Mueller Pamela L
Bought by
Cohen Steven and Cohen Sharon R
Home Financials for this Owner
Home Financials are based on the most recent Mortgage that was taken out on this home.
Original Mortgage
$123,246
Interest Rate
5.74%
Mortgage Type
Purchase Money Mortgage
Create a Home Valuation Report for This Property
The Home Valuation Report is an in-depth analysis detailing your home's value as well as a comparison with similar homes in the area
Home Values in the Area
Average Home Value in this Area
Purchase History
| Date | Buyer | Sale Price | Title Company |
|---|---|---|---|
| Schulman Allan | -- | None Available | |
| Schulman Allan | $120,000 | None Available | |
| Cohen Steven M | -- | -- | |
| Cohen Steven | $137,000 | Ticor Title Insurance |
Source: Public Records
Mortgage History
| Date | Status | Borrower | Loan Amount |
|---|---|---|---|
| Open | Schulman Allan | $97,680 | |
| Previous Owner | Cohen Steven | $123,246 |
Source: Public Records
Tax History Compared to Growth
Tax History
| Year | Tax Paid | Tax Assessment Tax Assessment Total Assessment is a certain percentage of the fair market value that is determined by local assessors to be the total taxable value of land and additions on the property. | Land | Improvement |
|---|---|---|---|---|
| 2024 | $2,002 | $12,498 | $923 | $11,575 |
| 2023 | $1,861 | $12,498 | $923 | $11,575 |
| 2022 | $1,861 | $12,498 | $923 | $11,575 |
| 2021 | $941 | $8,836 | $545 | $8,291 |
| 2020 | $1,052 | $8,836 | $545 | $8,291 |
| 2019 | $1,084 | $9,900 | $545 | $9,355 |
| 2018 | $537 | $7,842 | $503 | $7,339 |
| 2017 | $560 | $7,842 | $503 | $7,339 |
| 2016 | $1,053 | $7,842 | $503 | $7,339 |
| 2015 | $1,013 | $7,713 | $461 | $7,252 |
| 2014 | $1,017 | $7,713 | $461 | $7,252 |
| 2013 | $962 | $7,713 | $461 | $7,252 |
Source: Public Records
Map
Nearby Homes
- 3255 Kirchoff Rd Unit 306
- 3265 Kirchoff Rd Unit 223
- 3275 Kirchoff Rd Unit 337
- 3400 Wellington Ct Unit 306
- 3115 Town Square Dr Unit 206
- 3200 Thrush Ln
- 3316 Trillium Cir
- 2611 South St
- 3208 Wren Ln
- 2401 Rohlwing Rd
- 2600 Brookwood Way Dr Unit 316
- 2600 Brookwood Way Dr Unit 305
- 2600 Brookwood Unit 314
- 4101 Owl Dr
- 2650 Brookwood Way Dr Unit 108
- 2107 Kirchoff Rd
- 2100 Martin Ln
- 302 E Shady Dr
- 208 Brookdale Ln
- 2503 Fulle St Unit 17
- 3255 Kirchoff Rd Unit 101
- 3265 Kirchoff Rd Unit 318
- 3265 Kirchoff Rd Unit 126
- 3265 Kirchoff Rd Unit 118
- 3255 Kirchoff Rd Unit 213
- 3265 Kirchoff Rd Unit 214
- 3265 Kirchoff Rd Unit 220
- 3265 Kirchoff Rd Unit 327
- 3265 Kirchoff Rd Unit 314
- 3255 Kirchoff Rd Unit 313
- 3265 Kirchoff Rd Unit 316
- 3265 Kirchoff Rd Unit 225
- 3265 Kirchoff Rd Unit 218
- 3265 Kirchoff Rd Unit 217
- 3255 Kirchoff Rd Unit 205
- 3265 Kirchoff Rd Unit 122
- 3255 Kirchoff Rd Unit 105
- 3265 Kirchoff Rd Unit 228
- 3255 Kirchoff Rd Unit 112
- 3265 Kirchoff Rd Unit 224