Estimated Value: $220,000 - $390,000
--
Bed
1
Bath
1,229
Sq Ft
$240/Sq Ft
Est. Value
About This Home
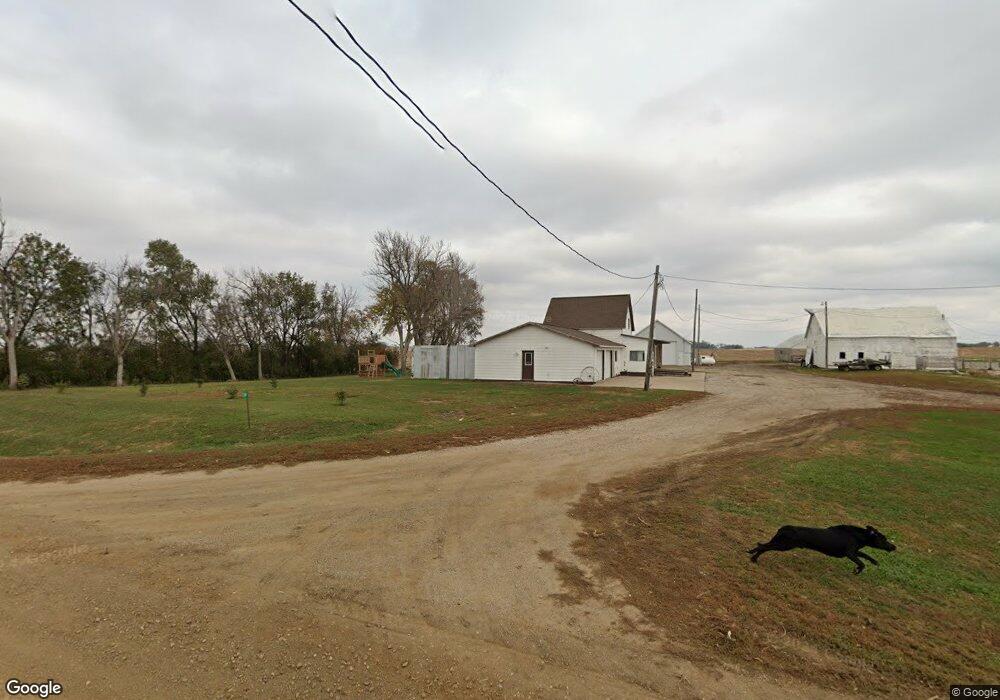
This home is located at 3268 Goldfinch Ave, Hull, IA 51239 and is currently estimated at $294,359, approximately $239 per square foot. 3268 Goldfinch Ave is a home located in Sioux County with nearby schools including Boyden-Hull Elementary School and Boyden-Hull High School.
Ownership History
Date
Name
Owned For
Owner Type
Purchase Details
Closed on
Jul 15, 2024
Sold by
Ohlson Dylan and Ohlson Abbigail B
Bought by
Strubbe Zachary V
Current Estimated Value
Home Financials for this Owner
Home Financials are based on the most recent Mortgage that was taken out on this home.
Original Mortgage
$175,000
Outstanding Balance
$97,140
Interest Rate
7.03%
Estimated Equity
$197,219
Purchase Details
Closed on
Nov 1, 2018
Sold by
Boeve Kenneth D and Boeve Beverly J
Bought by
Ohlson Dylan and Ohlson Abbigail B
Home Financials for this Owner
Home Financials are based on the most recent Mortgage that was taken out on this home.
Original Mortgage
$255,000
Interest Rate
4.7%
Mortgage Type
New Conventional
Create a Home Valuation Report for This Property
The Home Valuation Report is an in-depth analysis detailing your home's value as well as a comparison with similar homes in the area
Home Values in the Area
Average Home Value in this Area
Purchase History
| Date | Buyer | Sale Price | Title Company |
|---|---|---|---|
| Strubbe Zachary V | $350,000 | None Listed On Document | |
| Ohlson Dylan | $250,000 | -- |
Source: Public Records
Mortgage History
| Date | Status | Borrower | Loan Amount |
|---|---|---|---|
| Open | Strubbe Zachary V | $175,000 | |
| Open | Strubbe Zachary V | $382,375 | |
| Previous Owner | Ohlson Dylan | $255,000 |
Source: Public Records
Tax History Compared to Growth
Tax History
| Year | Tax Paid | Tax Assessment Tax Assessment Total Assessment is a certain percentage of the fair market value that is determined by local assessors to be the total taxable value of land and additions on the property. | Land | Improvement |
|---|---|---|---|---|
| 2025 | $1,148 | $145,670 | $6,830 | $138,840 |
| 2024 | $1,148 | $121,070 | $5,450 | $115,620 |
| 2023 | $1,126 | $121,070 | $5,450 | $115,620 |
| 2022 | $1,046 | $100,250 | $3,900 | $96,350 |
| 2021 | $1,010 | $97,760 | $4,230 | $93,530 |
| 2020 | $1,010 | $88,280 | $4,310 | $83,970 |
| 2019 | $930 | $83,190 | $6,220 | $76,970 |
| 2018 | $916 | $83,190 | $6,220 | $76,970 |
| 2017 | $916 | $83,190 | $6,220 | $76,970 |
| 2014 | $744 | $72,780 | $0 | $0 |
Source: Public Records
Map
Nearby Homes