
Seller's Agent in 2025
Andrew Wagner
Wagner Auctioneering and Real Estate
(765) 748-4509
128 Total Sales
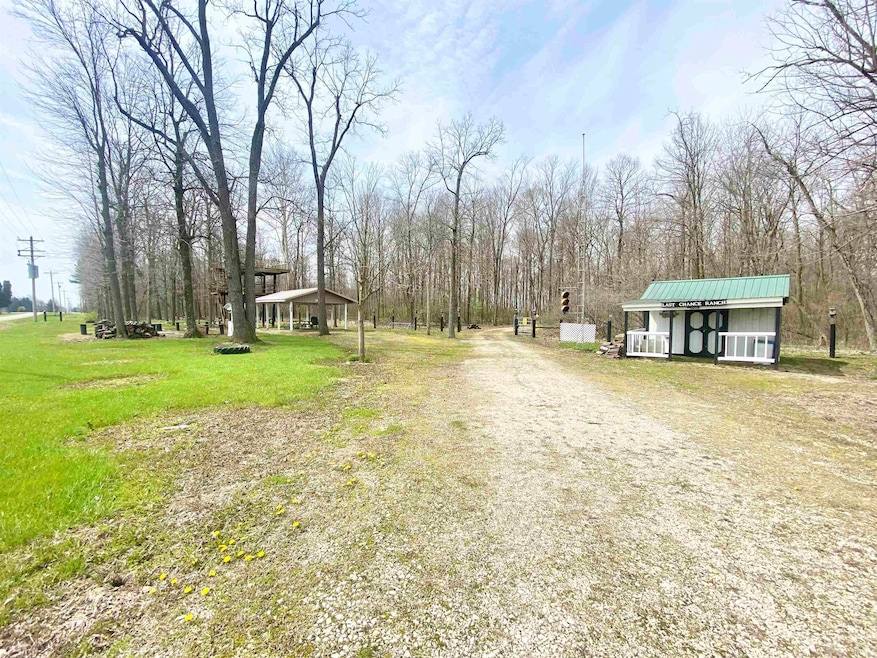
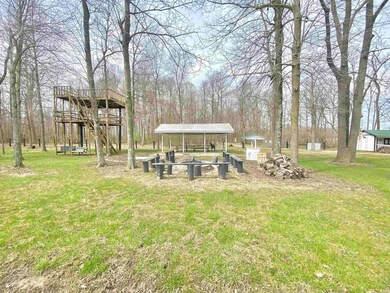
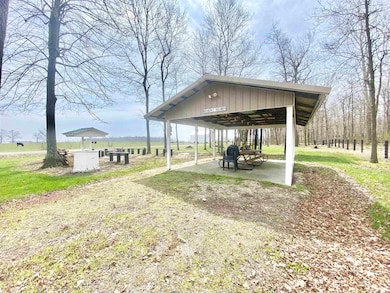
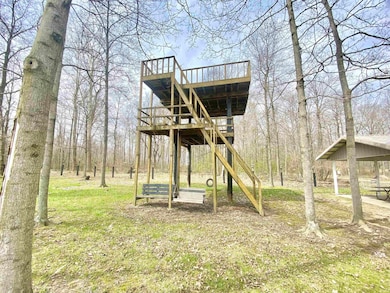
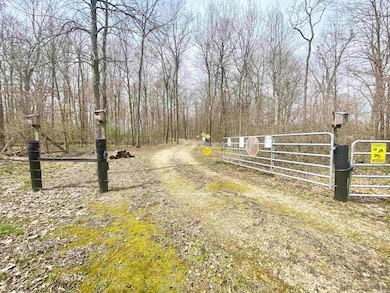
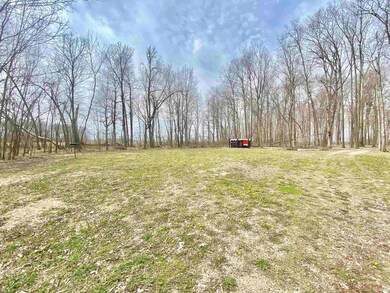
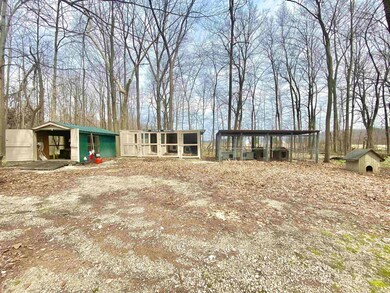
This home is located at 3268 S 400 W, Winchester, IN 47394 and is currently priced at $84,900. 3268 S 400 W is a home located in Randolph County with nearby schools including Winchester Community High School.
Last Agent to Sell the Property
Wagner Auctioneering and Real Estate Brokerage Email: wagnerauctioneering@yahoo.com Listed on: 04/14/2025
| Date | Type | Sale Price | Title Company |
|---|---|---|---|
| Warranty Deed | -- | None Listed On Document |
| Date | Status | Loan Amount | Loan Type |
|---|---|---|---|
| Open | $63,675 | Credit Line Revolving |
| Date | Event | Price | List to Sale | Price per Sq Ft |
|---|---|---|---|---|
| 05/19/2025 05/19/25 | Sold | $84,900 | 0.0% | -- |
| 04/15/2025 04/15/25 | Pending | -- | -- | -- |
| 04/14/2025 04/14/25 | For Sale | $84,900 | -- | -- |
| Year | Tax Paid | Tax Assessment Tax Assessment Total Assessment is a certain percentage of the fair market value that is determined by local assessors to be the total taxable value of land and additions on the property. | Land | Improvement |
|---|---|---|---|---|
| 2024 | $115 | $8,900 | $4,300 | $4,600 |
| 2023 | $105 | $8,200 | $3,600 | $4,600 |
| 2022 | $181 | $7,700 | $2,800 | $4,900 |
| 2021 | $181 | $7,800 | $2,400 | $5,400 |
| 2020 | $167 | $7,400 | $2,400 | $5,000 |
| 2019 | $165 | $7,500 | $2,900 | $4,600 |
| 2018 | $171 | $8,100 | $3,000 | $5,100 |
| 2017 | $164 | $8,500 | $3,500 | $5,000 |
| 2016 | $139 | $8,600 | $3,700 | $4,900 |
| 2014 | $69 | $7,700 | $3,800 | $3,900 |
| 2013 | $69 | $7,000 | $3,300 | $3,700 |
Seller's Agent in 2025
Andrew Wagner
Wagner Auctioneering and Real Estate
(765) 748-4509
128 Total Sales
Buyer's Agent in 2025
Jairo Correa
RE/MAX
(260) 251-7805
313 Total Sales
Source: Indiana Regional MLS
MLS Number: 202512695
APN: 68-14-10-100-021.000-011
Disclaimer: Certain information contained herein is derived from information provided by parties other than Homes.com. All information provided is deemed reliable, but is not guaranteed to be accurate and should be independently verified.
![]() IDX information is provided exclusively for personal, non-commercial use, and may not be used for any purpose other than to identify prospective properties consumers may be interested in purchasing. Information is deemed reliable but not guaranteed.
IDX information is provided exclusively for personal, non-commercial use, and may not be used for any purpose other than to identify prospective properties consumers may be interested in purchasing. Information is deemed reliable but not guaranteed.