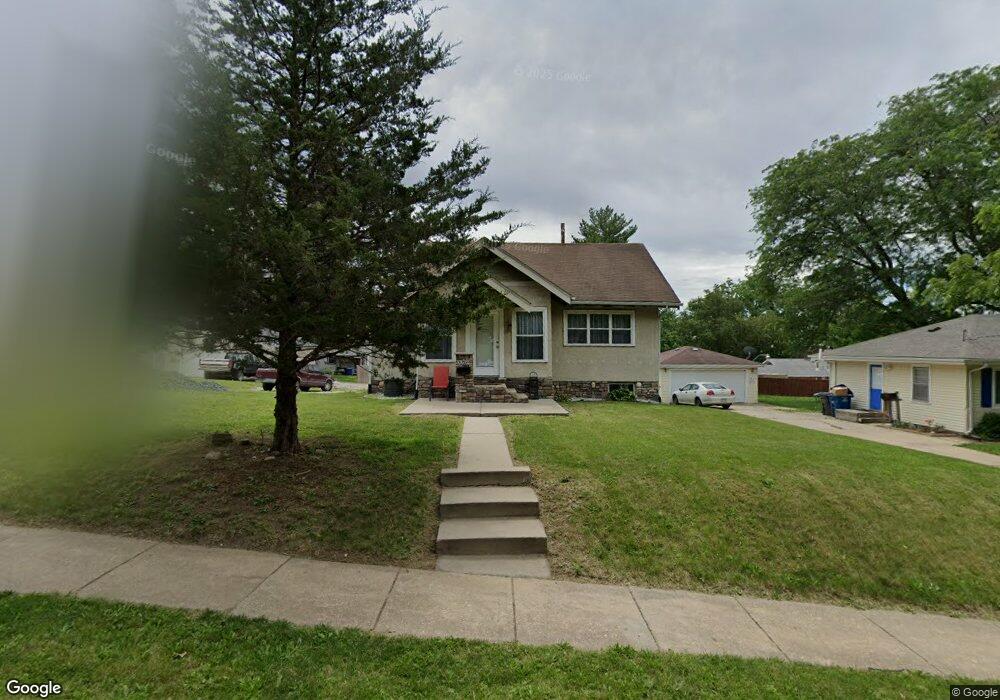
3269 Mahaska Ave Des Moines, IA 50317
Accent NeighborhoodEstimated Value: $135,000 - $172,000
2
Beds
1
Bath
1,032
Sq Ft
$153/Sq Ft
Est. Value
About This Home
This home is located at 3269 Mahaska Ave, Des Moines, IA 50317 and is currently estimated at $157,946, approximately $153 per square foot. 3269 Mahaska Ave is a home located in Polk County with nearby schools including Stowe Elementary School, Goodrell Middle School, and East High School.
Ownership History
Date
Name
Owned For
Owner Type
Purchase Details
Closed on
Dec 10, 2019
Sold by
Cuacuamoxtla Heber Martinez and Martinez Elida
Bought by
Cuacuamoxtla Heber Martinez and Martinez Elida
Current Estimated Value
Home Financials for this Owner
Home Financials are based on the most recent Mortgage that was taken out on this home.
Original Mortgage
$95,000
Outstanding Balance
$83,741
Interest Rate
3.7%
Mortgage Type
New Conventional
Estimated Equity
$74,205
Purchase Details
Closed on
Jul 21, 2005
Sold by
Neal Jeffrey D and Neal Shawna A
Bought by
Martinez Cuacuamoxtla Heber
Home Financials for this Owner
Home Financials are based on the most recent Mortgage that was taken out on this home.
Original Mortgage
$81,340
Interest Rate
5.68%
Mortgage Type
Fannie Mae Freddie Mac
Purchase Details
Closed on
Apr 11, 2005
Sold by
Garanson Kenneth R
Bought by
Neal Jeffrey D and Neal Shawna A
Create a Home Valuation Report for This Property
The Home Valuation Report is an in-depth analysis detailing your home's value as well as a comparison with similar homes in the area
Home Values in the Area
Average Home Value in this Area
Purchase History
| Date | Buyer | Sale Price | Title Company |
|---|---|---|---|
| Cuacuamoxtla Heber Martinez | -- | None Available | |
| Martinez Cuacuamoxtla Heber | $82,500 | -- | |
| Neal Jeffrey D | $34,500 | -- |
Source: Public Records
Mortgage History
| Date | Status | Borrower | Loan Amount |
|---|---|---|---|
| Open | Cuacuamoxtla Heber Martinez | $95,000 | |
| Closed | Martinez Cuacuamoxtla Heber | $81,340 |
Source: Public Records
Tax History Compared to Growth
Tax History
| Year | Tax Paid | Tax Assessment Tax Assessment Total Assessment is a certain percentage of the fair market value that is determined by local assessors to be the total taxable value of land and additions on the property. | Land | Improvement |
|---|---|---|---|---|
| 2025 | $2,750 | $158,100 | $32,300 | $125,800 |
| 2024 | $2,750 | $139,800 | $28,400 | $111,400 |
| 2023 | $2,644 | $139,800 | $28,400 | $111,400 |
| 2022 | $2,622 | $112,200 | $23,600 | $88,600 |
| 2021 | $2,542 | $112,100 | $23,600 | $88,500 |
| 2020 | $2,642 | $101,900 | $21,600 | $80,300 |
| 2019 | $2,432 | $101,900 | $21,600 | $80,300 |
| 2018 | $2,408 | $90,500 | $19,000 | $71,500 |
| 2017 | $2,328 | $90,500 | $19,000 | $71,500 |
| 2016 | $2,268 | $86,100 | $17,900 | $68,200 |
| 2015 | $2,268 | $86,100 | $17,900 | $68,200 |
| 2014 | $2,356 | $88,700 | $18,400 | $70,300 |
Source: Public Records
Map
Nearby Homes
- 3253 Dubuque Ave
- 1315 E 33rd Ct
- 1266 E 35th St
- 3248 Dubuque Ave
- 3403 Dubuque Ave
- 3121 Mahaska Ave
- 1408 E 33rd St
- 3540 E University Ave
- 1271 E 36th St
- 3201 Kinsey Ave
- 3265 E Washington Ave
- 3108 Kinsey Ave
- 1602 E 32nd St
- 1606 E 32nd St
- 2919 Garfield Ave
- 2940 Cleveland Ave
- 2925 Walker St
- 2916 Walker St
- 2938 Indianapolis Ave
- 2912 Cleveland Ave