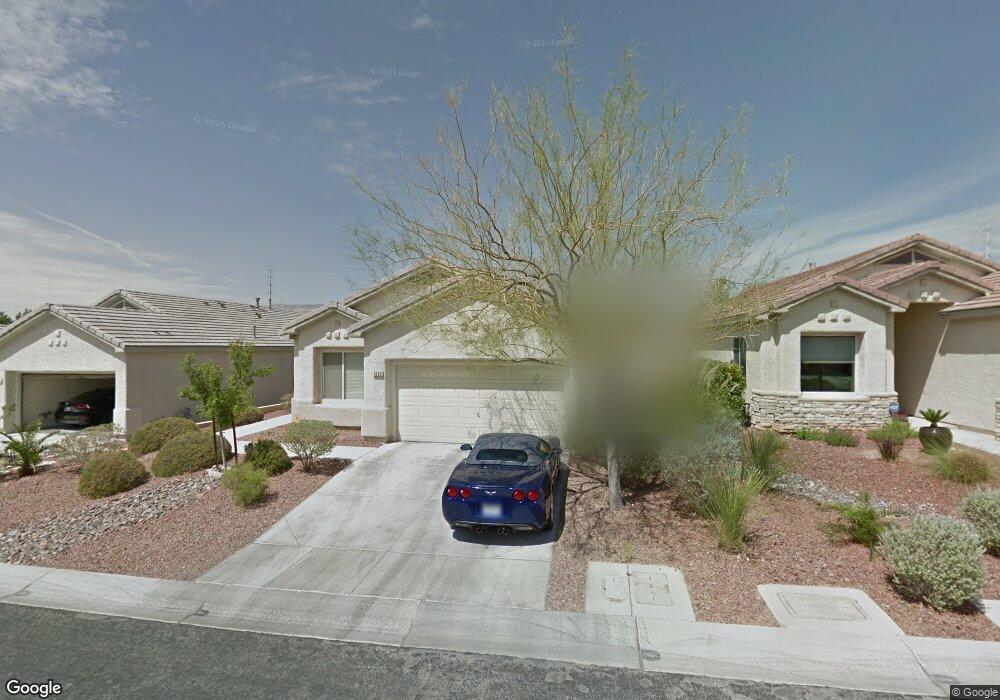
3269 Robins Creek Place Las Vegas, NV 89135
Summerlin NeighborhoodEstimated Value: $484,000 - $551,000
3
Beds
2
Baths
1,505
Sq Ft
$344/Sq Ft
Est. Value
About This Home
This home is located at 3269 Robins Creek Place, Las Vegas, NV 89135 and is currently estimated at $517,991, approximately $344 per square foot. 3269 Robins Creek Place is a home located in Clark County with nearby schools including Judy & John L. Goolsby Elementary School, Victoria Fertitta Middle School, and Palo Verde High School.
Ownership History
Date
Name
Owned For
Owner Type
Purchase Details
Closed on
Sep 23, 2016
Sold by
Glidewell Thomas W and Glidewell Tina M
Bought by
4T Family Trsut
Current Estimated Value
Purchase Details
Closed on
Jul 2, 2004
Sold by
Campbel Barbara N
Bought by
Glidewell Thomas W and Glidewell Tina M
Home Financials for this Owner
Home Financials are based on the most recent Mortgage that was taken out on this home.
Original Mortgage
$150,000
Interest Rate
6.29%
Mortgage Type
Unknown
Purchase Details
Closed on
Mar 5, 2003
Sold by
Pierce Donna F and Campbell Barbara M
Bought by
Campbell Barbara N
Purchase Details
Closed on
Nov 21, 2000
Sold by
Pn Ii Inc
Bought by
Pierce Donna F and Campbell Barbara N
Home Financials for this Owner
Home Financials are based on the most recent Mortgage that was taken out on this home.
Original Mortgage
$48,000
Interest Rate
7.86%
Create a Home Valuation Report for This Property
The Home Valuation Report is an in-depth analysis detailing your home's value as well as a comparison with similar homes in the area
Home Values in the Area
Average Home Value in this Area
Purchase History
| Date | Buyer | Sale Price | Title Company |
|---|---|---|---|
| 4T Family Trsut | -- | None Available | |
| Glidewell Thomas W | $250,000 | Ticor Title Of Nevada Inc | |
| Campbell Barbara N | -- | -- | |
| Pierce Donna F | $148,070 | Lawyers Title |
Source: Public Records
Mortgage History
| Date | Status | Borrower | Loan Amount |
|---|---|---|---|
| Previous Owner | Glidewell Thomas W | $150,000 | |
| Previous Owner | Pierce Donna F | $48,000 |
Source: Public Records
Tax History Compared to Growth
Tax History
| Year | Tax Paid | Tax Assessment Tax Assessment Total Assessment is a certain percentage of the fair market value that is determined by local assessors to be the total taxable value of land and additions on the property. | Land | Improvement |
|---|---|---|---|---|
| 2025 | $2,025 | $116,255 | $51,800 | $64,455 |
| 2024 | $1,966 | $116,255 | $51,800 | $64,455 |
| 2023 | $1,966 | $101,049 | $40,250 | $60,799 |
| 2022 | $1,909 | $87,481 | $31,850 | $55,631 |
| 2021 | $1,852 | $82,153 | $29,400 | $52,753 |
| 2020 | $1,795 | $80,694 | $28,350 | $52,344 |
| 2019 | $1,773 | $78,667 | $26,950 | $51,717 |
| 2018 | $1,692 | $70,173 | $20,650 | $49,523 |
| 2017 | $2,067 | $70,273 | $20,300 | $49,973 |
| 2016 | $1,584 | $65,369 | $15,400 | $49,969 |
| 2015 | $1,581 | $61,218 | $11,900 | $49,318 |
| 2014 | $1,535 | $50,543 | $8,400 | $42,143 |
Source: Public Records
Map
Nearby Homes
- 3257 Rushing Waters Place
- 3236 Rushing Waters Place
- 3215 Orange Sun St
- 11033 Ashboro Ave
- 10829 Ickworth Ct
- 11026 Ashboro Ave
- 3302 Saddle Soap Ct
- 10968 Tranquil Waters Ct
- 11053 Zarod Rd
- 3040 American River Ln
- 10799 Flame Vine Ct
- 10717 Refectory Ave
- 11251 La Madre Ridge Dr
- 2951 Brighton Creek Ct
- 2933 Red Springs Dr
- 11138 Twilight Times Ct
- 10809 Garden Mist Dr Unit 2105
- 10809 Garden Mist Dr Unit 1077
- 2952 Soft Horizon Way
- 3278 Dove Run Creek Dr
- 3249 Robins Creek Place
- 3289 Robins Creek Place
- 3290 Orange Sun St
- 3270 Orange Sun St
- 3250 Orange Sun St Unit 1
- 3227 Robins Creek Place
- 3268 Robins Creek Place
- 3248 Robins Creek Place
- 3288 Robins Creek Place
- 3238 Robins Creek Place
- 3230 Orange Sun St
- 10999 Pumpkin Ridge Ave
- 3217 Robins Creek Place
- 11003 Pumpkin Ridge Ave
- 10999 Pumpkin Ridge Ave
- 3228 Robins Creek Place
- 11015 Pumpkin Ridge Ave Unit none
- 11015 Pumpkin Ridge Ave
- 10991 Pumpkin Ridge Ave
- 10991 Pumpkin Ridge Ave Unit n/a