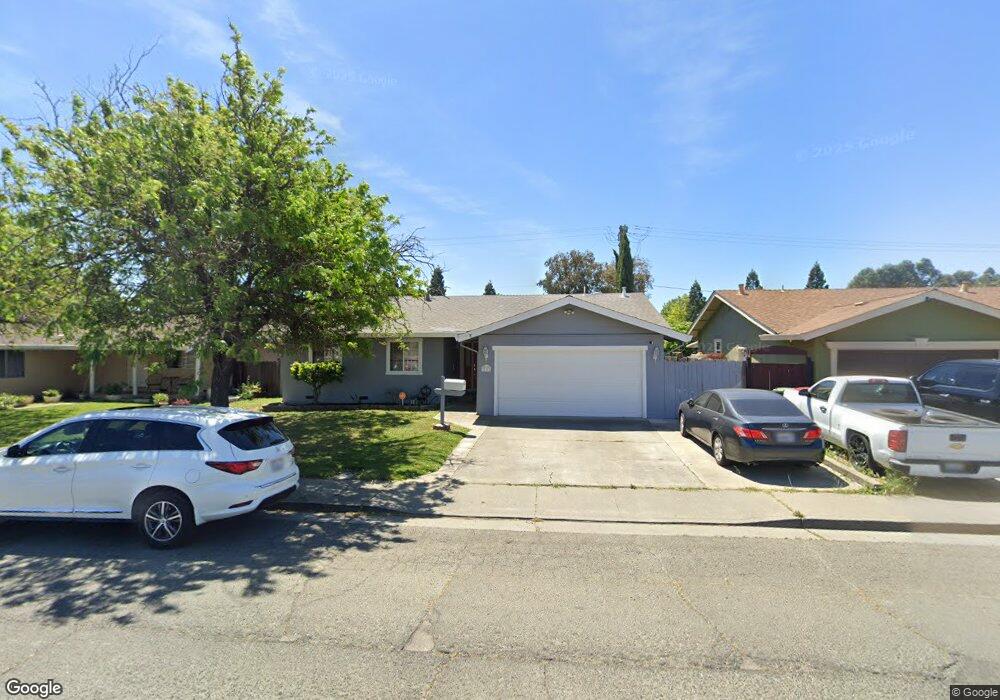
327 Dahlia St Fairfield, CA 94533
Estimated Value: $450,000 - $488,000
4
Beds
2
Baths
1,219
Sq Ft
$386/Sq Ft
Est. Value
About This Home
This home is located at 327 Dahlia St, Fairfield, CA 94533 and is currently estimated at $470,462, approximately $385 per square foot. 327 Dahlia St is a home located in Solano County with nearby schools including Dover Elementary School, Grange Middle School, and Fairfield High School.
Ownership History
Date
Name
Owned For
Owner Type
Purchase Details
Closed on
Mar 26, 2015
Sold by
Herrera Dania Martinez
Bought by
Alvarado Jorge C Martinez
Current Estimated Value
Home Financials for this Owner
Home Financials are based on the most recent Mortgage that was taken out on this home.
Original Mortgage
$184,000
Outstanding Balance
$141,341
Interest Rate
3.76%
Mortgage Type
New Conventional
Estimated Equity
$329,121
Purchase Details
Closed on
May 14, 2014
Sold by
Rachel Jeffrey
Bought by
Byrtus Deanna L
Purchase Details
Closed on
May 19, 2010
Sold by
Rachel Leon
Bought by
Rachel Leon
Purchase Details
Closed on
May 2, 2003
Sold by
Davis Fred L
Bought by
Rachel Leon
Purchase Details
Closed on
Mar 27, 1997
Sold by
Patmon Gail Carras
Bought by
Davis Fred L and Davis Marsha
Create a Home Valuation Report for This Property
The Home Valuation Report is an in-depth analysis detailing your home's value as well as a comparison with similar homes in the area
Home Values in the Area
Average Home Value in this Area
Purchase History
| Date | Buyer | Sale Price | Title Company |
|---|---|---|---|
| Alvarado Jorge C Martinez | -- | First American Title Company | |
| Alvarado Jorge C Martinez | $230,000 | First American Title Company | |
| Byrtus Deanna L | -- | None Available | |
| Rachel Leon | -- | None Available | |
| Rachel Leon | $140,000 | Placer Title Co | |
| Davis Fred L | $102,500 | Placer Title Company |
Source: Public Records
Mortgage History
| Date | Status | Borrower | Loan Amount |
|---|---|---|---|
| Open | Alvarado Jorge C Martinez | $184,000 | |
| Closed | Alvarado Jorge C Martinez | $184,000 |
Source: Public Records
Tax History Compared to Growth
Tax History
| Year | Tax Paid | Tax Assessment Tax Assessment Total Assessment is a certain percentage of the fair market value that is determined by local assessors to be the total taxable value of land and additions on the property. | Land | Improvement |
|---|---|---|---|---|
| 2025 | $3,101 | $276,415 | $66,097 | $210,318 |
| 2024 | $3,101 | $270,996 | $64,801 | $206,195 |
| 2023 | $3,006 | $265,683 | $63,531 | $202,152 |
| 2022 | $2,970 | $260,475 | $62,286 | $198,189 |
| 2021 | $2,941 | $255,368 | $61,065 | $194,303 |
| 2020 | $2,872 | $252,750 | $60,439 | $192,311 |
| 2019 | $2,802 | $247,795 | $59,254 | $188,541 |
| 2018 | $2,892 | $242,938 | $58,093 | $184,845 |
| 2017 | $2,759 | $238,175 | $56,954 | $181,221 |
| 2016 | $2,735 | $233,506 | $55,838 | $177,668 |
| 2015 | $2,200 | $204,921 | $46,107 | $158,814 |
| 2014 | $2,256 | $200,908 | $45,204 | $155,704 |
Source: Public Records
Map
Nearby Homes
- 280 Dahlia St
- 249 Dahlia St
- 223 Camellia St
- 2289 Rutland Ct
- 2284 Wiltshire Ct
- 2256 Dorset Ln
- 205 Alaska Ave
- 2657 Marigold Dr
- 50 Anza Ct
- 519 Pacific Ave
- 74 Anza Ct
- 2734 Laurel Dr
- 937 Pacific Ave
- 15 Dali Ct
- 32 Goya Dr
- 2207 Cunningham Dr
- 81 Del Prado Cir
- 1309 Sunningdale Ln
- 41 Goya Dr
- 1305 Sunningdale Ln