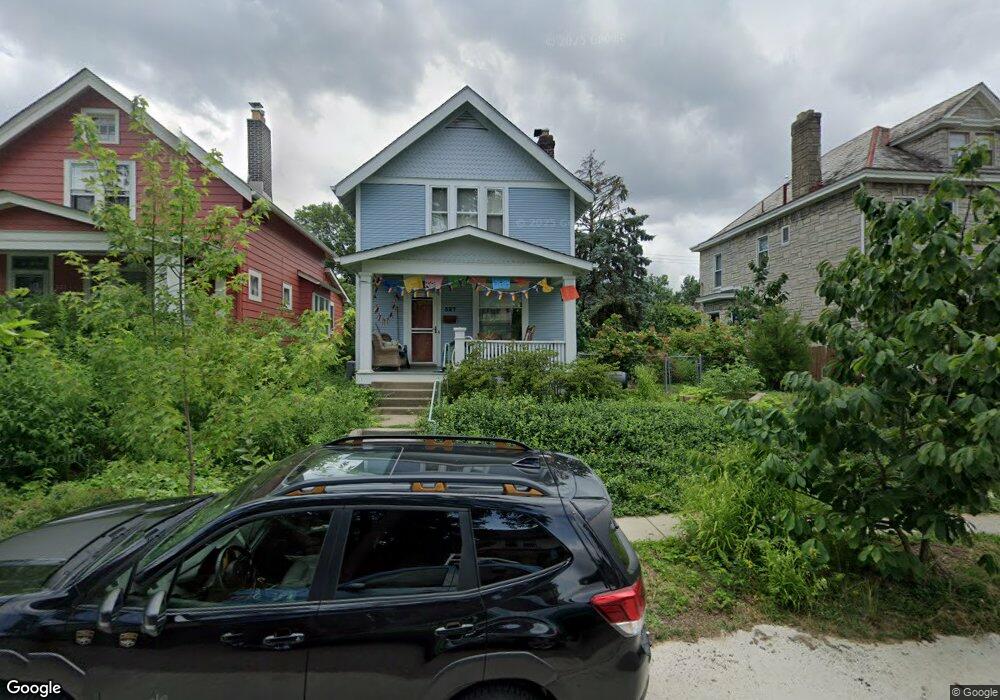
327 E Tulane Rd Columbus, OH 43202
Clintonville NeighborhoodEstimated Value: $387,152 - $421,000
2
Beds
2
Baths
1,184
Sq Ft
$341/Sq Ft
Est. Value
About This Home
This home is located at 327 E Tulane Rd, Columbus, OH 43202 and is currently estimated at $404,038, approximately $341 per square foot. 327 E Tulane Rd is a home located in Franklin County with nearby schools including Clinton Elementary School, Dominion Middle School, and Whetstone High School.
Ownership History
Date
Name
Owned For
Owner Type
Purchase Details
Closed on
Nov 4, 2005
Sold by
Hall Katherine L
Bought by
Wainwright Joel David and Mercer Kristin Lee
Current Estimated Value
Home Financials for this Owner
Home Financials are based on the most recent Mortgage that was taken out on this home.
Original Mortgage
$163,350
Interest Rate
5.98%
Mortgage Type
Fannie Mae Freddie Mac
Purchase Details
Closed on
Jun 29, 2001
Sold by
Butts Jeffrey C and Butts Laura M
Bought by
Hall Katherine L
Home Financials for this Owner
Home Financials are based on the most recent Mortgage that was taken out on this home.
Original Mortgage
$100,000
Interest Rate
7.27%
Mortgage Type
Purchase Money Mortgage
Purchase Details
Closed on
Nov 2, 1990
Bought by
Butts Jeffrey C and Butts Laura M
Purchase Details
Closed on
Aug 1, 1986
Purchase Details
Closed on
Nov 1, 1980
Create a Home Valuation Report for This Property
The Home Valuation Report is an in-depth analysis detailing your home's value as well as a comparison with similar homes in the area
Home Values in the Area
Average Home Value in this Area
Purchase History
| Date | Buyer | Sale Price | Title Company |
|---|---|---|---|
| Wainwright Joel David | $181,500 | Chicago Tit | |
| Hall Katherine L | $150,000 | Title First Agency Inc | |
| Butts Jeffrey C | $74,000 | -- | |
| -- | $56,500 | -- | |
| -- | $44,000 | -- |
Source: Public Records
Mortgage History
| Date | Status | Borrower | Loan Amount |
|---|---|---|---|
| Closed | Wainwright Joel David | $163,350 | |
| Closed | Hall Katherine L | $100,000 |
Source: Public Records
Tax History
| Year | Tax Paid | Tax Assessment Tax Assessment Total Assessment is a certain percentage of the fair market value that is determined by local assessors to be the total taxable value of land and additions on the property. | Land | Improvement |
|---|---|---|---|---|
| 2025 | $5,048 | $112,490 | $44,800 | $67,690 |
| 2024 | $5,048 | $112,490 | $44,800 | $67,690 |
| 2023 | $4,984 | $112,490 | $44,800 | $67,690 |
| 2022 | $4,015 | $77,420 | $33,110 | $44,310 |
| 2021 | $4,023 | $77,420 | $33,110 | $44,310 |
| 2020 | $4,028 | $77,420 | $33,110 | $44,310 |
| 2019 | $3,431 | $56,560 | $25,480 | $31,080 |
| 2018 | $3,619 | $56,560 | $25,480 | $31,080 |
| 2017 | $3,429 | $56,560 | $25,480 | $31,080 |
| 2016 | $4,201 | $63,420 | $24,640 | $38,780 |
| 2015 | $3,814 | $63,420 | $24,640 | $38,780 |
| 2014 | $3,823 | $63,420 | $24,640 | $38,780 |
| 2013 | $1,850 | $62,230 | $23,450 | $38,780 |
Source: Public Records
Map
Nearby Homes
- 2836-2838 Indianola Ave Unit 2836
- 296 Walhalla Rd
- 555 E Weber Rd
- 2680 Deming Ave
- 580 Crestview Rd
- 415 Glen Echo Cir
- 61 Tibet Rd
- 53 Olentangy St
- 109 E Arcadia Ave
- 45 E California Ave
- 534 Walhalla Rd
- 612 E Como Ave
- 76 E Lakeview Ave
- 3021 N High St
- 589 Clinton Heights Ave
- 2733 Beulah Rd
- 363 E Hudson St Unit 365
- 94 W Tulane Rd
- 83 Clinton Heights Ave
- 759 E Longview Ave
- 333 E Tulane Rd
- 321 E Tulane Rd
- 339 E Tulane Rd
- 315 E Tulane Rd
- 316 Crestview Rd
- 349 E Tulane Rd
- 324 Crestview Rd
- 309 E Tulane Rd
- 312 Crestview Rd
- 330 Crestview Rd
- 332 E Tulane Rd
- 326 E Tulane Rd
- 336 E Tulane Rd Unit 1
- 336 E Tulane Rd
- 336 E Tulane Rd Unit 1
- 334 Crestview Rd
- 306 Crestview Rd
- 320 E Tulane Rd
- 303 E Tulane Rd
- 338 Crestview Rd
Your Personal Tour Guide
Ask me questions while you tour the home.