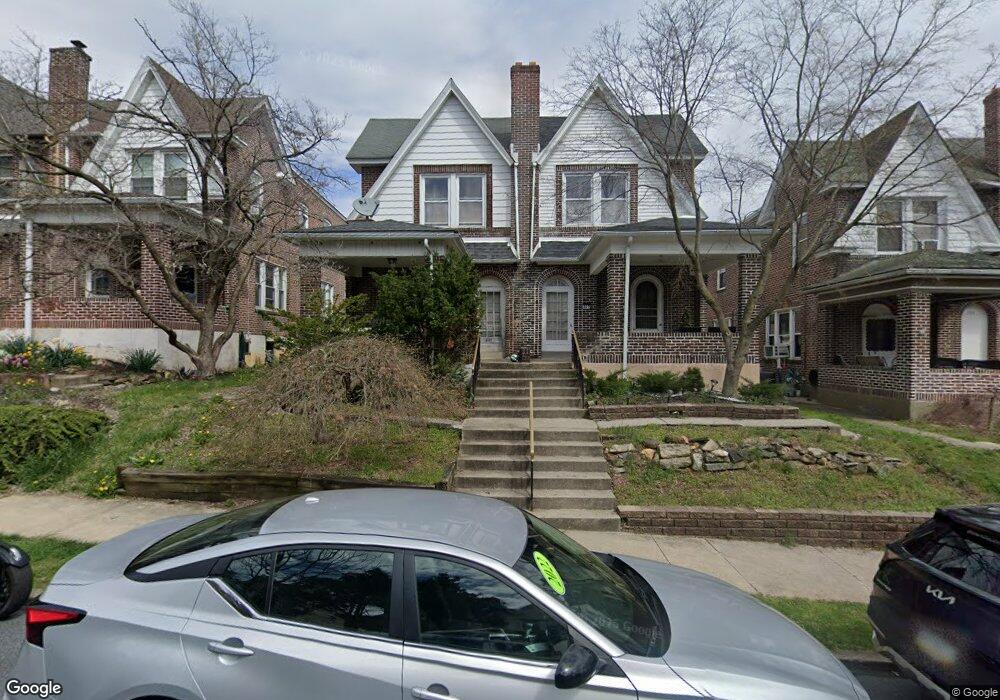
327 S Fulton St Allentown, PA 18102
West End Allentown NeighborhoodEstimated Value: $249,000 - $292,000
3
Beds
3
Baths
1,480
Sq Ft
$184/Sq Ft
Est. Value
About This Home
This home is located at 327 S Fulton St, Allentown, PA 18102 and is currently estimated at $272,259, approximately $183 per square foot. 327 S Fulton St is a home located in Lehigh County with nearby schools including Huntington Elementary School, Cleveland School, and Union Terrace Elementary School.
Ownership History
Date
Name
Owned For
Owner Type
Purchase Details
Closed on
Jun 10, 2025
Sold by
Martinez Cristine Figueroa
Bought by
Fabregas Cera Jorge L and Rodriguez Garcia Tiana
Current Estimated Value
Home Financials for this Owner
Home Financials are based on the most recent Mortgage that was taken out on this home.
Original Mortgage
$284,747
Outstanding Balance
$284,016
Interest Rate
6.81%
Mortgage Type
FHA
Estimated Equity
-$11,757
Purchase Details
Closed on
Nov 6, 2020
Sold by
Azzam Samer
Bought by
Martinez Cristine Figueroa
Home Financials for this Owner
Home Financials are based on the most recent Mortgage that was taken out on this home.
Original Mortgage
$171,830
Interest Rate
2.9%
Mortgage Type
FHA
Purchase Details
Closed on
Jul 30, 1998
Sold by
Stribula John S and Stribula Lisa Ann
Bought by
Azzam Samer
Purchase Details
Closed on
Feb 28, 1990
Sold by
Weinschenk Susan
Bought by
Stribula John S and Lisa Ann
Purchase Details
Closed on
Jun 16, 1989
Sold by
Muhleisen Curtis E and Muhleisen Deborah L
Bought by
Weinschenk Susan
Purchase Details
Closed on
May 11, 1979
Bought by
Muhleisen Curtis E and Muhleisen Deborah L
Create a Home Valuation Report for This Property
The Home Valuation Report is an in-depth analysis detailing your home's value as well as a comparison with similar homes in the area
Home Values in the Area
Average Home Value in this Area
Purchase History
| Date | Buyer | Sale Price | Title Company |
|---|---|---|---|
| Fabregas Cera Jorge L | $290,000 | None Listed On Document | |
| Martinez Cristine Figueroa | $175,000 | Liberty Abstract Company | |
| Azzam Samer | $64,500 | -- | |
| Stribula John S | $89,000 | -- | |
| Weinschenk Susan | $83,900 | -- | |
| Muhleisen Curtis E | $39,000 | -- |
Source: Public Records
Mortgage History
| Date | Status | Borrower | Loan Amount |
|---|---|---|---|
| Open | Fabregas Cera Jorge L | $284,747 | |
| Previous Owner | Martinez Cristine Figueroa | $171,830 |
Source: Public Records
Tax History Compared to Growth
Tax History
| Year | Tax Paid | Tax Assessment Tax Assessment Total Assessment is a certain percentage of the fair market value that is determined by local assessors to be the total taxable value of land and additions on the property. | Land | Improvement |
|---|---|---|---|---|
| 2025 | $3,608 | $110,600 | $10,100 | $100,500 |
| 2024 | $3,608 | $110,600 | $10,100 | $100,500 |
| 2023 | $3,608 | $110,600 | $10,100 | $100,500 |
| 2022 | $3,482 | $110,600 | $100,500 | $10,100 |
| 2021 | $3,412 | $110,600 | $10,100 | $100,500 |
| 2020 | $3,324 | $110,600 | $10,100 | $100,500 |
| 2019 | $3,270 | $110,600 | $10,100 | $100,500 |
| 2018 | $3,050 | $110,600 | $10,100 | $100,500 |
| 2017 | $2,973 | $110,600 | $10,100 | $100,500 |
| 2016 | -- | $110,600 | $10,100 | $100,500 |
| 2015 | -- | $110,600 | $10,100 | $100,500 |
| 2014 | -- | $110,600 | $10,100 | $100,500 |
Source: Public Records
Map
Nearby Homes
- 304 S Fulton St
- 127 S 16th St
- 128 S West St
- 134 S Franklin St
- 406 S 17th St
- 129 S Saint Cloud St
- 39 S 17th St
- 119 S 14th St
- 216 S 13th St
- 120 S 13th St
- 1331 W Maple St
- 1244 W Union St
- 1420 W Linden St
- 1225 SW Walnut
- 128 S 12th St
- 24 N 13th St
- 42 N 13th St
- 127 N Franklin St
- 36 N Jefferson St
- 1605 W Turner St
- 325 S Fulton St
- 329 S Fulton St
- 323 S Fulton St
- 331 S Fulton St
- 321 S Fulton St
- 319 S Fulton St
- 317 S Fulton St
- 315 S Fulton St
- 328 S Fulton St
- 330 S Fulton St
- 326 S Fulton St
- 313 S Fulton St
- 324 S Fulton St
- 332 S Fulton St
- 322 S Fulton St
- 311 S Fulton St
- 320 S Fulton St
- 318 S Fulton St
- 302-338 S 15th St
- 309 S Fulton St