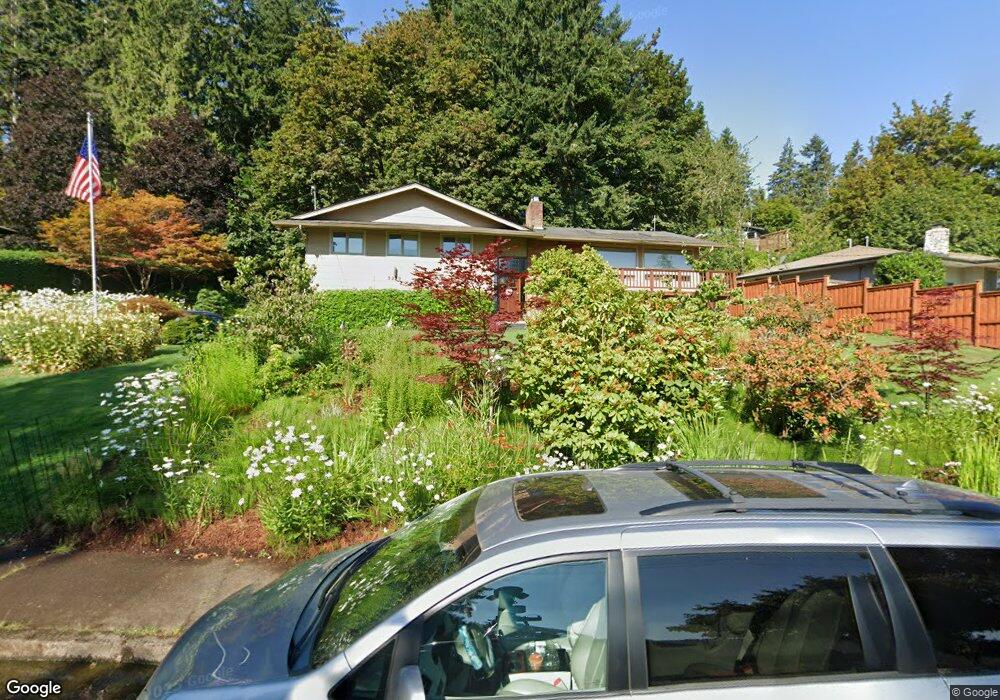
3270 Fillmore St Eugene, OR 97405
Crest Drive NeighborhoodEstimated Value: $657,000 - $696,000
4
Beds
3
Baths
2,436
Sq Ft
$277/Sq Ft
Est. Value
About This Home
This home is located at 3270 Fillmore St, Eugene, OR 97405 and is currently estimated at $674,903, approximately $277 per square foot. 3270 Fillmore St is a home located in Lane County with nearby schools including Adams Elementary School, Arts And Technology Academy At Jefferson, and Churchill High School.
Ownership History
Date
Name
Owned For
Owner Type
Purchase Details
Closed on
Oct 25, 2024
Sold by
Mollere Willie S
Bought by
Willie Sullivan Mollere Family Trust and Mollere
Current Estimated Value
Purchase Details
Closed on
Mar 29, 2016
Sold by
Schneider Daniel A and Davigo Teresa A
Bought by
Mollere Willie S
Purchase Details
Closed on
Jan 30, 2012
Sold by
Dark Patricia Jane
Bought by
Schneider Daniel A and Davigo Teresa A
Home Financials for this Owner
Home Financials are based on the most recent Mortgage that was taken out on this home.
Original Mortgage
$253,409
Interest Rate
3.88%
Mortgage Type
FHA
Purchase Details
Closed on
Nov 3, 2010
Sold by
Dark Patricia Jane
Bought by
Dark Patricia Jane and Dark Credit Shelter Trust
Purchase Details
Closed on
Jul 17, 2007
Sold by
Dark Robert Gilmore and Dark Patricia J
Bought by
Dark Robert Gilmore and Dark Patricia Jane
Create a Home Valuation Report for This Property
The Home Valuation Report is an in-depth analysis detailing your home's value as well as a comparison with similar homes in the area
Home Values in the Area
Average Home Value in this Area
Purchase History
| Date | Buyer | Sale Price | Title Company |
|---|---|---|---|
| Willie Sullivan Mollere Family Trust | -- | None Listed On Document | |
| Mollere Willie S | $370,000 | Cascade Title Company | |
| Schneider Daniel A | $260,000 | Cascade Title Company | |
| Dark Patricia Jane | -- | None Available | |
| Dark Robert Gilmore | -- | None Available |
Source: Public Records
Mortgage History
| Date | Status | Borrower | Loan Amount |
|---|---|---|---|
| Previous Owner | Schneider Daniel A | $253,409 |
Source: Public Records
Tax History
| Year | Tax Paid | Tax Assessment Tax Assessment Total Assessment is a certain percentage of the fair market value that is determined by local assessors to be the total taxable value of land and additions on the property. | Land | Improvement |
|---|---|---|---|---|
| 2025 | $7,962 | $408,653 | -- | -- |
| 2024 | $7,863 | $396,751 | -- | -- |
| 2023 | $7,863 | $385,196 | $0 | $0 |
| 2022 | $7,366 | $373,977 | $0 | $0 |
| 2021 | $6,919 | $363,085 | $0 | $0 |
| 2020 | $6,943 | $352,510 | $0 | $0 |
| 2019 | $6,706 | $342,243 | $0 | $0 |
| 2018 | $6,312 | $322,597 | $0 | $0 |
| 2017 | $5,913 | $322,597 | $0 | $0 |
| 2016 | $5,161 | $283,801 | $0 | $0 |
| 2015 | $5,006 | $275,535 | $0 | $0 |
| 2014 | $4,875 | $267,510 | $0 | $0 |
Source: Public Records
Map
Nearby Homes
- 0 Mclean Blvd Unit 24671448
- 0 Mclean Blvd Unit 697374759
- 1778 Graham Dr
- 2311 Douglas Dr
- 3160 Whitten Dr
- 2090 Graham Dr
- 2765 Almaden St
- 2850 Garfield St
- 2030 W 34th Ave
- 1 Storey Blvd
- 2 Storey Blvd
- 2673 Garfield St
- 951 W 27th Ave
- 0 Hidden Meadows
- 2037 Morning View Dr
- 605 Fulvue Dr
- 3854 Monroe St
- 2565 Braewood Ln
- 806 Sundance St
- 0 W 40th Ave Unit 3 545854116
- 3260 Fillmore St
- 3280 Fillmore St
- 3265 Chambers St
- 3275 Chambers St Unit VRM
- 3275 Chambers St
- 3265 Fillmore St
- 3275 Fillmore St
- 3240 Fillmore St
- 3255 Chambers St
- 3245 Fillmore St
- 3285 Fillmore St
- 3285 Chambers St
- 3300 Fillmore St
- 3235 Chambers St
- 3230 Fillmore St
- 3250 Whitbeck Blvd
- 3260 Whitbeck Blvd
- 3231 Fillmore St
- 3240 Whitbeck Blvd
Your Personal Tour Guide
Ask me questions while you tour the home.