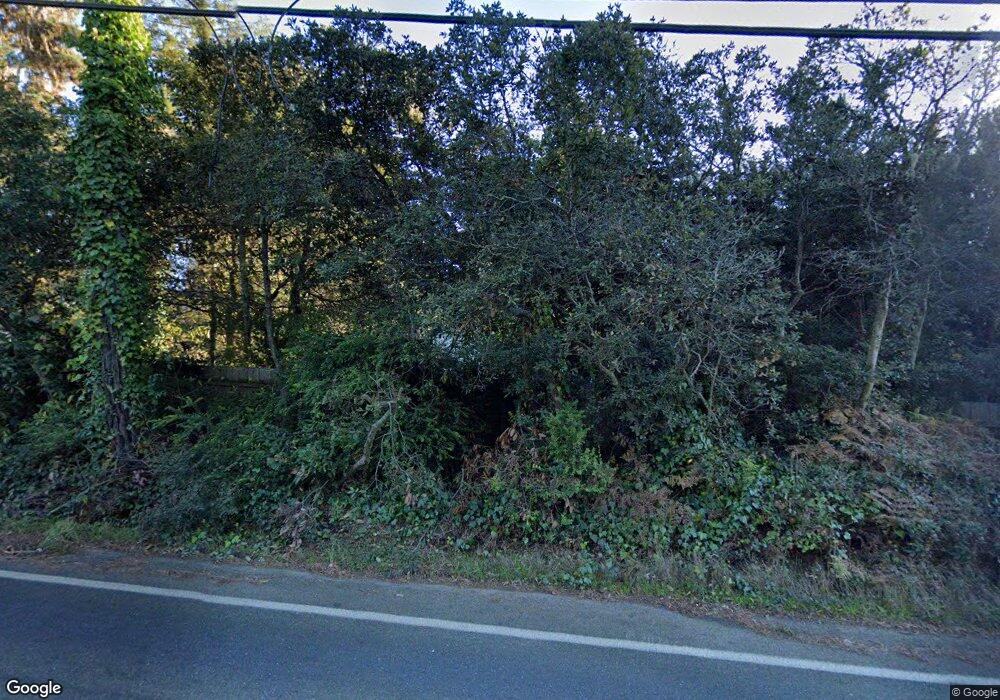
32701 Simpson Ln Fort Bragg, CA 95437
Estimated Value: $477,576 - $702,000
Studio
--
Bath
--
Sq Ft
43,560
Sq Ft Lot
About This Home
This home is located at 32701 Simpson Ln, Fort Bragg, CA 95437 and is currently estimated at $549,644. 32701 Simpson Ln is a home located in Mendocino County with nearby schools including Fort Bragg High School and Three Rivers Charter School.
Ownership History
Date
Name
Owned For
Owner Type
Purchase Details
Closed on
Oct 20, 2021
Sold by
Rittiman Carl A and Davey Lori J
Bought by
Rittiman Carl A and Davey Lori J
Current Estimated Value
Purchase Details
Closed on
Jun 1, 2004
Sold by
Rittiman Carl A and Davey Lori
Bought by
Rittiman Carl A and Davey Lori J
Home Financials for this Owner
Home Financials are based on the most recent Mortgage that was taken out on this home.
Original Mortgage
$155,000
Outstanding Balance
$75,363
Interest Rate
5.92%
Mortgage Type
New Conventional
Estimated Equity
$474,281
Purchase Details
Closed on
Aug 22, 2002
Sold by
Comer Charlene
Bought by
Rittiman Carl A and Davey Lori
Home Financials for this Owner
Home Financials are based on the most recent Mortgage that was taken out on this home.
Original Mortgage
$44,000
Interest Rate
6.17%
Mortgage Type
Seller Take Back
Purchase Details
Closed on
Mar 22, 1999
Sold by
Callahan Clara
Bought by
Comer Charlene
Create a Home Valuation Report for This Property
The Home Valuation Report is an in-depth analysis detailing your home's value as well as a comparison with similar homes in the area
Home Values in the Area
Average Home Value in this Area
Purchase History
| Date | Buyer | Sale Price | Title Company |
|---|---|---|---|
| Rittiman Carl A | -- | None Available | |
| Rittiman Carl A | -- | Redwood Empire Title | |
| Rittiman Carl A | $59,000 | Redwood Empire Title Company | |
| Comer Charlene | -- | -- |
Source: Public Records
Mortgage History
| Date | Status | Borrower | Loan Amount |
|---|---|---|---|
| Open | Rittiman Carl A | $155,000 | |
| Previous Owner | Rittiman Carl A | $44,000 |
Source: Public Records
Tax History
| Year | Tax Paid | Tax Assessment Tax Assessment Total Assessment is a certain percentage of the fair market value that is determined by local assessors to be the total taxable value of land and additions on the property. | Land | Improvement |
|---|---|---|---|---|
| 2025 | $3,748 | $316,612 | $85,440 | $231,172 |
| 2023 | $3,748 | $304,320 | $82,123 | $222,197 |
| 2022 | $3,730 | $298,354 | $80,513 | $217,841 |
| 2021 | $3,520 | $292,505 | $78,935 | $213,570 |
| 2020 | $3,448 | $289,514 | $78,131 | $211,383 |
| 2019 | $3,404 | $283,838 | $76,599 | $207,239 |
| 2018 | $3,348 | $278,273 | $75,098 | $203,175 |
| 2017 | $3,129 | $272,818 | $73,626 | $199,192 |
| 2016 | $3,068 | $267,468 | $72,182 | $195,286 |
| 2015 | $3,020 | $263,452 | $71,099 | $192,353 |
| 2014 | $2,948 | $258,291 | $69,706 | $188,585 |
Source: Public Records
Map
Nearby Homes
- 14875 Atkins
- 32875 Simpson Ln
- 17750 Barbizon Ln
- 17900 N Hwy 1 Ms19 Hwy
- 19400 Dorffi Rd
- 19251 Monterey Ave
- 19351 Del Mar Dr
- 33440 Pacific Way
- 17290 Ocean Dr
- 19701 Noyo Acres Dr
- 19204 Benson Ln
- 17600 Redwood Springs Dr
- 16611 Pearl Ranch Rd
- 575 S Whipple St
- 137 Olsen Ln
- 517 S Lincoln St
- 459 S Mcpherson St
- 16500 Pine Dr
- 210 S Mcpherson St
- 215 S Sanderson Way
- 32681 Simpson Ln
- 32725 Simpson Ln
- 14950 Atkins
- 32685 Rhoda Ln
- 33730 Simpson Rd
- 18501 Hare Creek Terrace
- 18500 Hare Creek Terrace
- 32680 Atkins Way
- 32625 Simpson Ln
- 32657 Simpson Ln
- 32751 Simpson Ln
- 32665 Simpson Ln
- 32770 Simpson Ln
- 18550 Hare Creek Terrace
- 32760 Simpson Ln
- 18511 Estels Ct
- 32601 Simpson Ln
- 32681 Atkins Way
Your Personal Tour Guide
Ask me questions while you tour the home.