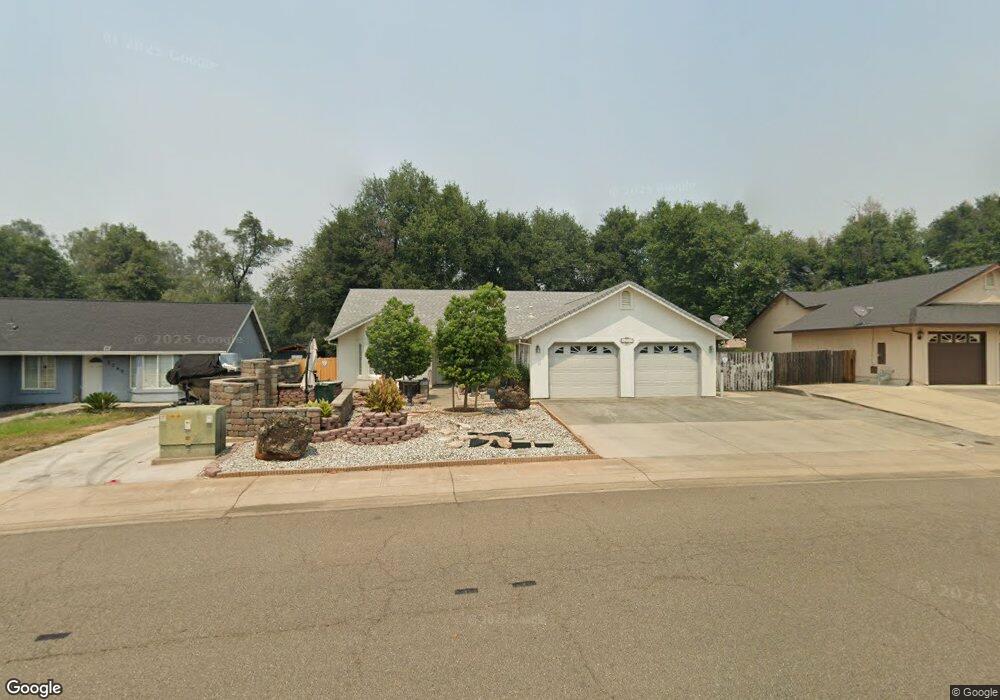
3271 Lawrence Rd Redding, CA 96002
Enterprise NeighborhoodEstimated Value: $369,192 - $419,000
3
Beds
2
Baths
1,508
Sq Ft
$257/Sq Ft
Est. Value
About This Home
This home is located at 3271 Lawrence Rd, Redding, CA 96002 and is currently estimated at $387,548, approximately $256 per square foot. 3271 Lawrence Rd is a home located in Shasta County with nearby schools including Rother Elementary School, Parsons Junior High School, and Enterprise High School.
Ownership History
Date
Name
Owned For
Owner Type
Purchase Details
Closed on
Nov 2, 2020
Sold by
Norman N And Charlotte L Fifer Trust 199 and Buccino Virginia N
Bought by
Buccino Virginia L
Current Estimated Value
Purchase Details
Closed on
Mar 16, 2011
Sold by
Fifer Norman and Fifer Charlotte L
Bought by
Fifer Norman N and Fifer Charlotte L
Purchase Details
Closed on
Sep 6, 2001
Sold by
Gray Development Corp
Bought by
Fifer Norman and Fifer Charlotte L
Create a Home Valuation Report for This Property
The Home Valuation Report is an in-depth analysis detailing your home's value as well as a comparison with similar homes in the area
Home Values in the Area
Average Home Value in this Area
Purchase History
| Date | Buyer | Sale Price | Title Company |
|---|---|---|---|
| Buccino Virginia L | -- | None Listed On Document | |
| Fifer Norman N | -- | None Available | |
| Fifer Norman | $166,500 | Chicago Title Co |
Source: Public Records
Tax History
| Year | Tax Paid | Tax Assessment Tax Assessment Total Assessment is a certain percentage of the fair market value that is determined by local assessors to be the total taxable value of land and additions on the property. | Land | Improvement |
|---|---|---|---|---|
| 2025 | $2,615 | $245,650 | $51,691 | $193,959 |
| 2024 | $2,639 | $240,834 | $50,678 | $190,156 |
| 2023 | $2,639 | $236,113 | $49,685 | $186,428 |
| 2022 | $2,564 | $231,484 | $48,711 | $182,773 |
| 2021 | $2,477 | $226,946 | $47,756 | $179,190 |
| 2020 | $2,466 | $224,620 | $47,267 | $177,353 |
| 2019 | $2,370 | $220,217 | $46,341 | $173,876 |
| 2018 | $2,341 | $215,900 | $45,433 | $170,467 |
| 2017 | $2,381 | $211,668 | $44,543 | $167,125 |
| 2016 | $2,226 | $207,519 | $43,670 | $163,849 |
| 2015 | $2,206 | $204,403 | $43,015 | $161,388 |
| 2014 | $2,189 | $200,400 | $42,173 | $158,227 |
Source: Public Records
Map
Nearby Homes
- 3178 Lawrence Rd
- 3360 Lawrence Rd
- 3283 Middleton Ln
- 3293 Middleton Ln
- 1091 Del Sol Place
- 1075 Le Brun Ln
- 1397 Empress Ln
- 2893 Alfreda Way
- 2906 Regal Ave
- 2855 Irwin Rd
- 2820 Alfreda Way
- 1354 Harpole Rd
- 3087 Northwoods Way
- 3527 Adams Ln
- 0 Churn Creek Rd Unit 25-496
- 0 Churn Creek Rd Unit 26-609
- 3759 Alma Ave
- 890 Parsons Dr
- 1513 Harpole Rd
- 3466 Silverwood St
- 3263 Lawrence Rd
- 3279 Lawrence Rd
- 3255 Lawrence Rd
- 3287 Lawrence Rd
- 3241 Lawrence Rd
- 3278 Lawrence Rd
- 3288 Lawrence Rd
- 3235 Lawrence Rd
- Lot 89 Lawrence Rd
- 87,88,89 Lawrence Rd
- 3235/3241 Lawrence Rd
- 0 Lawrence Rd
- Lot 88 Lawrence Rd
- 3247 Lawrence Rd
- 3315 Meridian Dr
- 3295 Lawrence Rd
- 3300 Lawrence Rd
- 1346 Gehring Ct
- 3355 Meridian Dr
- 1414 Augustine Way
Your Personal Tour Guide
Ask me questions while you tour the home.