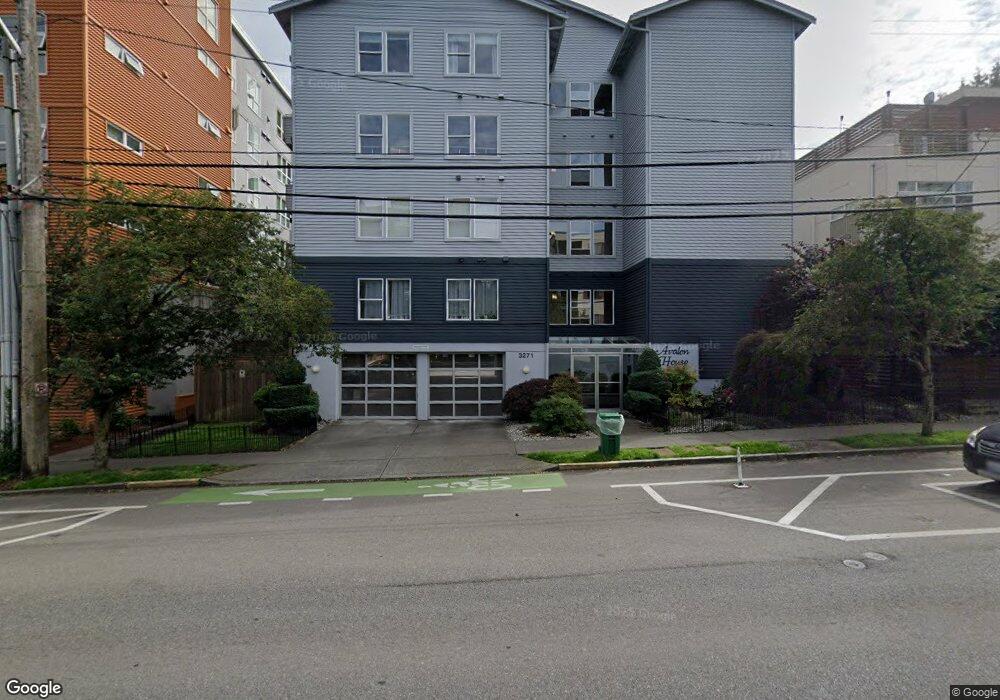
3271 SW Avalon Way Unit 301 Seattle, WA 98126
North Delridge NeighborhoodEstimated Value: $281,000 - $364,000
1
Bed
1
Bath
574
Sq Ft
$571/Sq Ft
Est. Value
About This Home
This home is located at 3271 SW Avalon Way Unit 301, Seattle, WA 98126 and is currently estimated at $327,828, approximately $571 per square foot. 3271 SW Avalon Way Unit 301 is a home located in King County with nearby schools including Fairmount Park Elementary, Madison Middle School, and West Seattle High School.
Ownership History
Date
Name
Owned For
Owner Type
Purchase Details
Closed on
May 8, 2001
Sold by
Blass Rashell
Bought by
Brusco Kim J
Current Estimated Value
Purchase Details
Closed on
Jul 16, 1998
Sold by
Janson Jeffrey L
Bought by
Blass Rashell
Home Financials for this Owner
Home Financials are based on the most recent Mortgage that was taken out on this home.
Original Mortgage
$76,800
Interest Rate
6.9%
Purchase Details
Closed on
Nov 20, 1994
Sold by
Nutt Eric L and Nutt Becky V
Bought by
Janson Jeffrey L
Home Financials for this Owner
Home Financials are based on the most recent Mortgage that was taken out on this home.
Original Mortgage
$92,450
Interest Rate
8.92%
Mortgage Type
FHA
Purchase Details
Closed on
Apr 3, 1992
Sold by
Schneider Homes Inc
Bought by
Nutt Eric L and Nutt Becky
Create a Home Valuation Report for This Property
The Home Valuation Report is an in-depth analysis detailing your home's value as well as a comparison with similar homes in the area
Home Values in the Area
Average Home Value in this Area
Purchase History
| Date | Buyer | Sale Price | Title Company |
|---|---|---|---|
| Brusco Kim J | $121,000 | First American Title Ins Co | |
| Blass Rashell | $96,000 | Chicago Title Insurance Co | |
| Janson Jeffrey L | $95,000 | Western Title Co | |
| Nutt Eric L | $93,000 | -- |
Source: Public Records
Mortgage History
| Date | Status | Borrower | Loan Amount |
|---|---|---|---|
| Previous Owner | Blass Rashell | $76,800 | |
| Previous Owner | Janson Jeffrey L | $92,450 |
Source: Public Records
Tax History Compared to Growth
Tax History
| Year | Tax Paid | Tax Assessment Tax Assessment Total Assessment is a certain percentage of the fair market value that is determined by local assessors to be the total taxable value of land and additions on the property. | Land | Improvement |
|---|---|---|---|---|
| 2024 | $2,751 | $288,000 | $75,400 | $212,600 |
| 2023 | $2,830 | $302,000 | $75,400 | $226,600 |
| 2022 | $2,699 | $293,000 | $75,400 | $217,600 |
| 2021 | $2,725 | $296,000 | $67,900 | $228,100 |
| 2020 | $2,863 | $284,000 | $66,000 | $218,000 |
| 2018 | $2,340 | $270,000 | $47,100 | $222,900 |
| 2017 | $1,974 | $238,000 | $37,700 | $200,300 |
| 2016 | $1,668 | $207,000 | $37,700 | $169,300 |
| 2015 | $1,498 | $170,000 | $33,900 | $136,100 |
| 2014 | -- | $156,000 | $30,100 | $125,900 |
| 2013 | -- | $116,000 | $30,100 | $85,900 |
Source: Public Records
Map
Nearby Homes
- 3256 SW Avalon Way Unit 301
- 3230 SW Avalon Way
- 3210 SW Avalon Way
- 3221 SW Avalon Way Unit 113
- 3202 SW Avalon Way Unit 102
- 3112 SW Avalon Way Unit 102
- 3112 SW Avalon Way Unit 302
- 3046 SW Avalon Way
- 4040 32nd Ave SW
- 2827 SW Nevada St
- 4710 37th Ave SW Unit B
- 4725 37th Ave SW
- 2831 SW Yancy St Unit A
- 3817 SW Dakota St
- 3022 SW Bradford St Unit 401
- 3022 SW Bradford St Unit 205
- 4521 40th Ave SW Unit B
- 4533 40th Ave SW Unit C
- 4017 39th Ave SW
- 3523 SW Charlestown St
- 3271 SW Avalon Way Unit 101
- 3271 SW Avalon Way Unit 102
- 3271 SW Avalon Way Unit 403
- 3271 SW Avalon Way Unit 202
- 3271 SW Avalon Way Unit 201
- 3271 SW Avalon Way Unit 401
- 3271 SW Avalon Way Unit 104
- 3271 SW Avalon Way Unit 302
- 3271 SW Avalon Way Unit 303
- 3271 SW Avalon Way Unit 404
- 3271 SW Avalon Way Unit 402
- 3271 SW Avalon Way Unit 203
- 3271 SW Avalon Way Unit 304
- 3271 SW Avalon Way
- 3261 SW Avalon Way
- 3261 SW Avalon Way
- 3275 SW Avalon Way
- 3273 SW Avalon Way Unit A
- 3273 SW Avalon Way Unit B
- 3279 SW Avalon Way