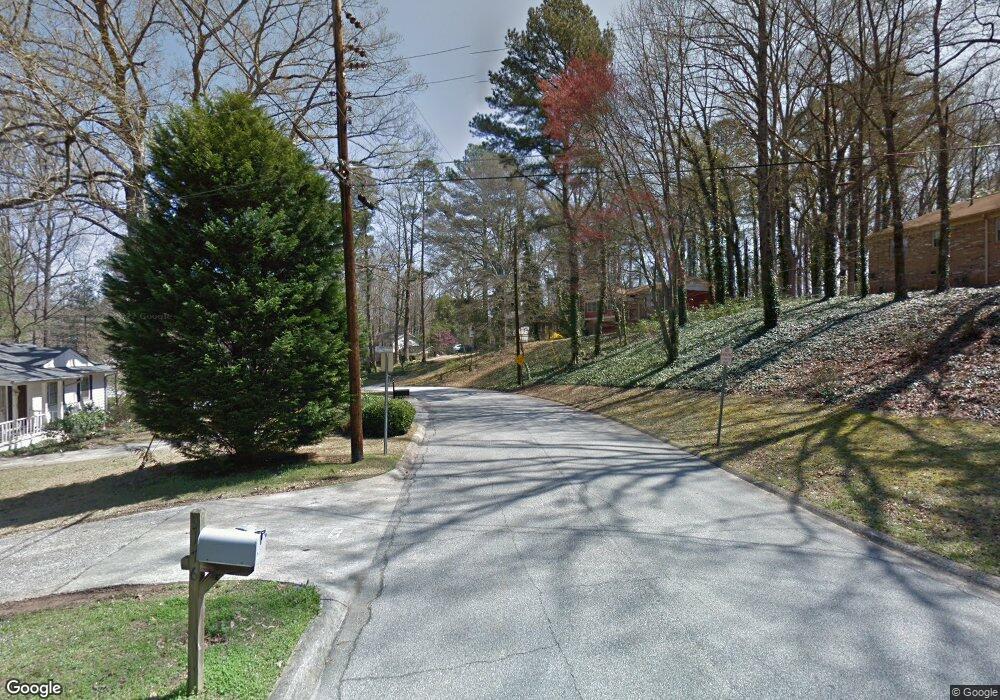
3272 Ann Rd SE Smyrna, GA 30080
Estimated Value: $370,830 - $460,000
3
Beds
3
Baths
1,378
Sq Ft
$305/Sq Ft
Est. Value
About This Home
This home is located at 3272 Ann Rd SE, Smyrna, GA 30080 and is currently estimated at $420,458, approximately $305 per square foot. 3272 Ann Rd SE is a home located in Cobb County with nearby schools including Teasley Elementary School, Campbell Middle School, and Campbell High School.
Ownership History
Date
Name
Owned For
Owner Type
Purchase Details
Closed on
Dec 29, 2010
Sold by
Federal Home Loan Mortgage Corporation
Bought by
Brewer David W
Current Estimated Value
Home Financials for this Owner
Home Financials are based on the most recent Mortgage that was taken out on this home.
Original Mortgage
$125,729
Outstanding Balance
$85,278
Interest Rate
4.75%
Mortgage Type
FHA
Estimated Equity
$335,180
Purchase Details
Closed on
Sep 7, 2010
Sold by
Suntrust Mtg Inc
Bought by
Federal Home Loan Mortgage Corporation
Purchase Details
Closed on
Nov 5, 2004
Sold by
Gowland Winfred
Bought by
Reed Danielle R
Home Financials for this Owner
Home Financials are based on the most recent Mortgage that was taken out on this home.
Original Mortgage
$195,000
Interest Rate
5.25%
Mortgage Type
New Conventional
Create a Home Valuation Report for This Property
The Home Valuation Report is an in-depth analysis detailing your home's value as well as a comparison with similar homes in the area
Home Values in the Area
Average Home Value in this Area
Purchase History
| Date | Buyer | Sale Price | Title Company |
|---|---|---|---|
| Brewer David W | $129,000 | -- | |
| Federal Home Loan Mortgage Corporation | -- | -- | |
| Suntrust Mtg Inc | $163,128 | -- | |
| Reed Danielle R | $195,000 | -- |
Source: Public Records
Mortgage History
| Date | Status | Borrower | Loan Amount |
|---|---|---|---|
| Open | Brewer David W | $125,729 | |
| Previous Owner | Reed Danielle R | $195,000 |
Source: Public Records
Tax History Compared to Growth
Tax History
| Year | Tax Paid | Tax Assessment Tax Assessment Total Assessment is a certain percentage of the fair market value that is determined by local assessors to be the total taxable value of land and additions on the property. | Land | Improvement |
|---|---|---|---|---|
| 2025 | $4,226 | $155,612 | $52,000 | $103,612 |
| 2024 | $4,226 | $155,612 | $52,000 | $103,612 |
| 2023 | $3,623 | $133,392 | $44,000 | $89,392 |
| 2022 | $3,006 | $109,876 | $24,000 | $85,876 |
| 2021 | $3,020 | $109,876 | $24,000 | $85,876 |
| 2020 | $2,753 | $100,148 | $24,000 | $76,148 |
| 2019 | $2,753 | $100,148 | $24,000 | $76,148 |
| 2018 | $2,427 | $88,272 | $24,000 | $64,272 |
| 2017 | $1,779 | $68,984 | $18,000 | $50,984 |
| 2016 | $1,779 | $68,984 | $18,000 | $50,984 |
| 2015 | $1,821 | $68,984 | $18,000 | $50,984 |
| 2014 | $1,776 | $66,644 | $0 | $0 |
Source: Public Records
Map
Nearby Homes
- 3320 Sleepy Ln SE
- 2040 Argyle Dr SE
- Glover Plan at Archerfield
- Reynolds Plan at Archerfield
- 3408 Archerfield Way
- 3416 Archerfield Way
- 3415 Archerfield Way
- 3404 Archerfield Way
- 2327 Goodwood Blvd SE
- 2376 Oakwood Way SE
- 2324 Goodwood Blvd SE
- 3465 Fenton Dr SE
- 1910 Countryside Place SE
- 3351 Vintage Cir SE
- 7 Villa Ct SE
- 1601 Countryside Place SE
- 2128 Sonoma Dr SE
- 3365 Vintage Cir SE Unit 5
- 3365 Vintage Cir SE
- 1502 Countryside Place SE
- 3260 Ann Rd SE
- 0 Ann Rd Unit 8036201
- 0 Ann Rd Unit 7102848
- 0 Ann Rd
- 3284 Ann Rd SE
- 3294 Ann Rd SE
- 3248 Ann Rd SE
- 3285 Ann Rd SE
- 3235 Isoline Way SE
- 3275 Ann Rd SE
- 3275 Ann Rd SE Unit 25
- 3265 Ann Rd SE
- 3241 Isoline Way SE
- 3241 Isoline Way SE Unit 3
- 3255 Ann Rd SE
- 3299 Ann Rd SE
- 3304 Ann Rd SE
- 3219 Isoline Way SE
- 3251 Isoline Way SE
- 3245 Ann Rd SE