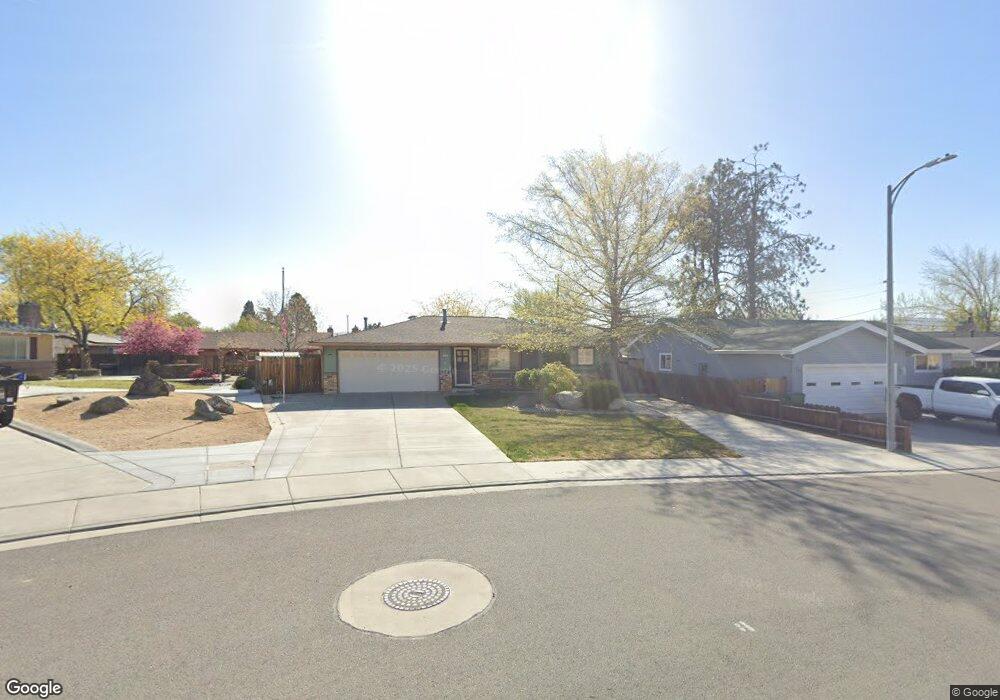
3272 Sprout Way Sparks, NV 89431
McCarran Boulevard-Probasco NeighborhoodEstimated Value: $413,444 - $458,000
3
Beds
2
Baths
1,249
Sq Ft
$348/Sq Ft
Est. Value
About This Home
This home is located at 3272 Sprout Way, Sparks, NV 89431 and is currently estimated at $434,111, approximately $347 per square foot. 3272 Sprout Way is a home located in Washoe County with nearby schools including Hershal H. Beam Elementary School, Lena Juniper Elementary School, and Lou Mendive Middle School.
Ownership History
Date
Name
Owned For
Owner Type
Purchase Details
Closed on
Nov 17, 2015
Sold by
Brien Kathleen A O
Bought by
Brien Schwartz Kathleen O and Schwartz Stan G
Current Estimated Value
Purchase Details
Closed on
Jun 22, 2005
Sold by
Gingras Sean M and Carusillo Gina
Bought by
Obrien Kathleen A
Home Financials for this Owner
Home Financials are based on the most recent Mortgage that was taken out on this home.
Original Mortgage
$236,800
Outstanding Balance
$123,305
Interest Rate
5.72%
Mortgage Type
Fannie Mae Freddie Mac
Estimated Equity
$310,806
Purchase Details
Closed on
Oct 25, 2000
Sold by
Lepori Barbara A
Bought by
Gingras Sean M and Carusillo Gina
Home Financials for this Owner
Home Financials are based on the most recent Mortgage that was taken out on this home.
Original Mortgage
$103,600
Interest Rate
7.88%
Create a Home Valuation Report for This Property
The Home Valuation Report is an in-depth analysis detailing your home's value as well as a comparison with similar homes in the area
Home Values in the Area
Average Home Value in this Area
Purchase History
| Date | Buyer | Sale Price | Title Company |
|---|---|---|---|
| Brien Schwartz Kathleen O | -- | None Available | |
| Obrien Kathleen A | $296,000 | Western Title Incorporated | |
| Gingras Sean M | $129,500 | Stewart Title Northern Nevad | |
| Lepori Barbara A | -- | Stewart Title Northern Nevad |
Source: Public Records
Mortgage History
| Date | Status | Borrower | Loan Amount |
|---|---|---|---|
| Open | Obrien Kathleen A | $236,800 | |
| Previous Owner | Gingras Sean M | $103,600 |
Source: Public Records
Tax History Compared to Growth
Tax History
| Year | Tax Paid | Tax Assessment Tax Assessment Total Assessment is a certain percentage of the fair market value that is determined by local assessors to be the total taxable value of land and additions on the property. | Land | Improvement |
|---|---|---|---|---|
| 2025 | $1,066 | $55,971 | $36,715 | $19,256 |
| 2024 | $1,035 | $53,714 | $34,755 | $18,959 |
| 2023 | $1,035 | $52,487 | $34,930 | $17,557 |
| 2022 | $1,003 | $42,780 | $28,455 | $14,325 |
| 2021 | $974 | $33,588 | $19,635 | $13,953 |
| 2020 | $944 | $31,538 | $17,850 | $13,688 |
| 2019 | $917 | $32,457 | $18,725 | $13,732 |
| 2018 | $890 | $27,463 | $13,545 | $13,918 |
| 2017 | $865 | $25,263 | $10,868 | $14,395 |
| 2016 | $843 | $26,705 | $11,550 | $15,155 |
| 2015 | $841 | $25,174 | $9,415 | $15,759 |
| 2014 | $816 | $23,556 | $7,980 | $15,576 |
| 2013 | -- | $21,757 | $5,985 | $15,772 |
Source: Public Records
Map
Nearby Homes
- 780 Emerson Way
- 465 Lenwood Dr
- 3252 Holman Way
- 3465 Dawn Cir
- 3269 Valley Forge Way
- 5530 High Rock Way
- 119 Devere Way
- 3245 Elaine Way
- 3607 Keogh Dr
- 1125 Dodson Way
- 3545 4th St
- 0 N Mccarran Blvd Unit 250052909
- 1160 York Way
- 1110 Xman Way
- 1345 Plymouth Way
- 120 E Lenwood Dr
- 10 Sheridan Way
- 1023 Tyler Way
- 1940 4th St Unit 20
- 1940 4th St Unit 51
- 6220 Emerson Way
- 3260 Sprout Way
- 3278 Sprout Way
- 3285 Montecito Dr
- 3295 Montecito Dr
- 3265 Montecito Dr
- 3280 Sprout Way
- 3301 Montecito Dr
- 3235 Montecito Dr
- 3271 Sprout Way
- 3265 Sprout Way
- 3277 Sprout Way
- 3235 Sprout Way
- 730 Emerson Way Unit 5B
- 3307 Montecito Dr
- 686 Abbay Way
- 685 Abbay Way
- 781 Mercy Ct
- 3215 Sprout Way
- 791 Mercy Ct