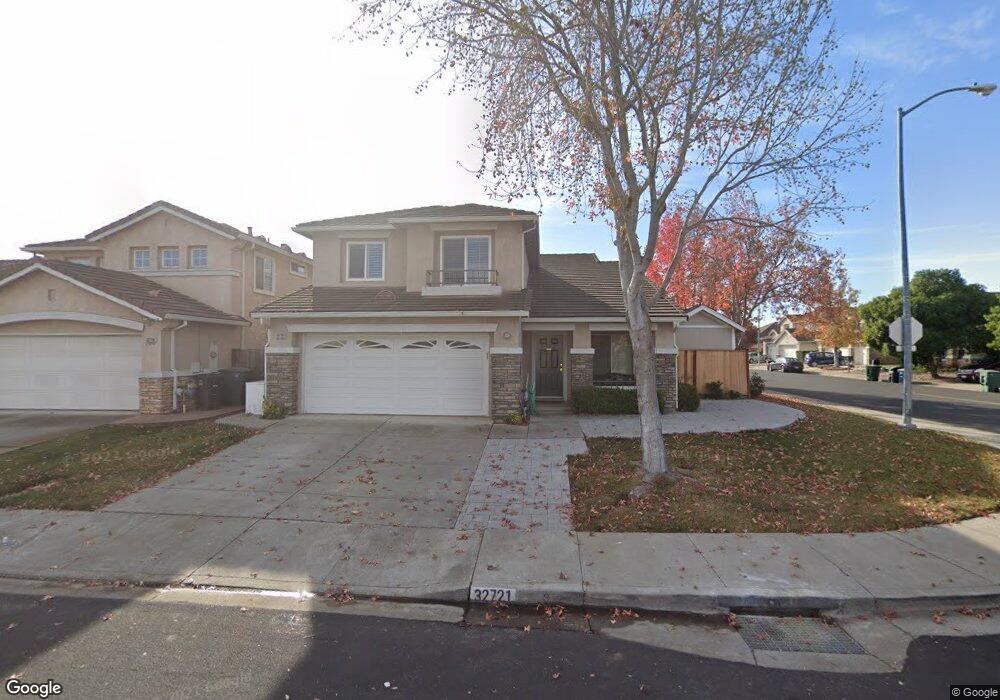
32721 Belami Loop Union City, CA 94587
Estimated Value: $1,729,000 - $1,820,000
4
Beds
3
Baths
2,283
Sq Ft
$771/Sq Ft
Est. Value
About This Home
This home is located at 32721 Belami Loop, Union City, CA 94587 and is currently estimated at $1,760,211, approximately $771 per square foot. 32721 Belami Loop is a home located in Alameda County with nearby schools including Tom Kitayama Elementary School, Cesar Chavez Middle School, and James Logan High School.
Ownership History
Date
Name
Owned For
Owner Type
Purchase Details
Closed on
Mar 28, 2024
Sold by
Sharifi Nazifa Barati
Bought by
Nazifa Sharifi Trust and Sharifi
Current Estimated Value
Purchase Details
Closed on
May 2, 2003
Sold by
Sharifi Nazifa Barati and Sharifi Mohammad Asef
Bought by
Sharifi Nazifa and Sharifi Nazifi Barati
Purchase Details
Closed on
Oct 2, 2001
Sold by
Sharifi Mohammad Asef
Bought by
Sharifi Nazifi and Sharifi Nazifi Barati
Home Financials for this Owner
Home Financials are based on the most recent Mortgage that was taken out on this home.
Original Mortgage
$275,000
Interest Rate
6.91%
Purchase Details
Closed on
Aug 6, 1998
Sold by
Nadem Dean Amir
Bought by
Barati Zarmina
Purchase Details
Closed on
Jun 4, 1998
Sold by
Kaufman & Broad South Bay Inc
Bought by
Sharifi Mohammad Asef and Sharifi Nazifa Barati
Home Financials for this Owner
Home Financials are based on the most recent Mortgage that was taken out on this home.
Original Mortgage
$296,650
Interest Rate
7.17%
Create a Home Valuation Report for This Property
The Home Valuation Report is an in-depth analysis detailing your home's value as well as a comparison with similar homes in the area
Home Values in the Area
Average Home Value in this Area
Purchase History
| Date | Buyer | Sale Price | Title Company |
|---|---|---|---|
| Nazifa Sharifi Trust | -- | None Listed On Document | |
| Sharifi Nazifa | -- | Alliance Title Company | |
| Sharifi Nazifi | -- | Placer Title Company | |
| Barati Zarmina | -- | Fidelity National Title | |
| Sharifi Mohammad Asef | $371,000 | First American Title Guarant |
Source: Public Records
Mortgage History
| Date | Status | Borrower | Loan Amount |
|---|---|---|---|
| Previous Owner | Sharifi Nazifi | $275,000 | |
| Previous Owner | Sharifi Mohammad Asef | $296,650 |
Source: Public Records
Tax History
| Year | Tax Paid | Tax Assessment Tax Assessment Total Assessment is a certain percentage of the fair market value that is determined by local assessors to be the total taxable value of land and additions on the property. | Land | Improvement |
|---|---|---|---|---|
| 2025 | $8,705 | $585,204 | $175,633 | $416,571 |
| 2024 | $8,705 | $573,595 | $172,190 | $408,405 |
| 2023 | $8,415 | $569,212 | $168,814 | $400,398 |
| 2022 | $8,261 | $551,051 | $165,504 | $392,547 |
| 2021 | $8,076 | $540,109 | $162,259 | $384,850 |
| 2020 | $7,923 | $541,502 | $160,596 | $380,906 |
| 2019 | $7,994 | $530,887 | $157,448 | $373,439 |
| 2018 | $7,808 | $520,479 | $154,361 | $366,118 |
| 2017 | $7,621 | $510,276 | $151,335 | $358,941 |
| 2016 | $7,345 | $500,273 | $148,369 | $351,904 |
| 2015 | $7,204 | $492,758 | $146,140 | $346,618 |
| 2014 | $6,934 | $483,108 | $143,278 | $339,830 |
Source: Public Records
Map
Nearby Homes
- 2116 Sunsprite Dr
- 2676 Great Arbor Way Unit 45
- 32656 Brenda Way Unit 2
- 32625 Brenda Way Unit 1
- 32224 Sloccum Ct
- 32651 Singh Cir
- 2432 Balmoral St
- 2447 Douglas St
- 2473 Balmoral St
- 32262 Crest Ln
- 179 Kona Cir
- 426 Honolulu Cir
- 23 Palm Dr
- 30 Palm Dr Unit 30
- 418 Fiji Cir Unit 418
- 3020 San Andreas Dr
- 259 Molokai Cir Unit 259
- 269 Oahu Cir
- 2523 Copa Del Oro Dr
- 33010 Lake Mead Dr
- 32729 Belami Loop
- 32724 S Belami Loop
- 32737 Belami Loop
- 32732 S Belami Loop
- 32740 S Belami Loop
- 32720 Belami Loop
- 32728 Belami Loop
- 2040 Kitayama Dr
- 2044 Kitayama Dr
- 32745 Belami Loop
- 32736 Belami Loop
- 32748 S Belami Loop
- 2048 Kitayama Dr
- 32744 Belami Loop
- 32753 Belami Loop
- 2052 Kitayama Dr
- 32756 S Belami Loop
- 32717 S Folklore Loop
- 32725 S Belami Loop
- 32733 S Belami Loop
Your Personal Tour Guide
Ask me questions while you tour the home.