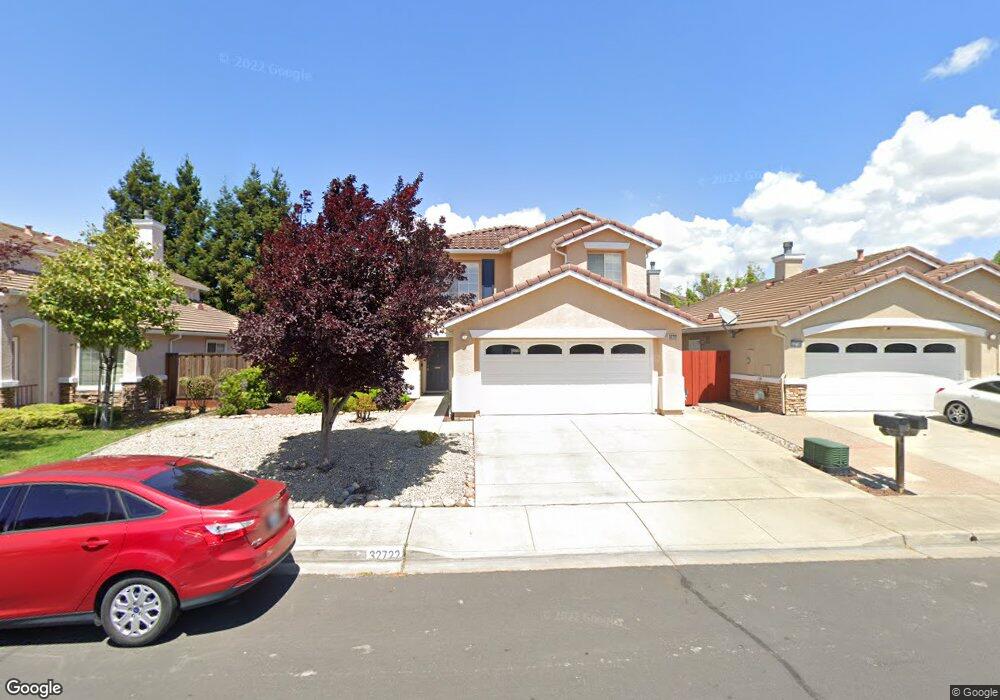
32722 Folklore Loop Union City, CA 94587
Estimated Value: $1,584,221 - $1,721,000
3
Beds
3
Baths
2,104
Sq Ft
$776/Sq Ft
Est. Value
About This Home
This home is located at 32722 Folklore Loop, Union City, CA 94587 and is currently estimated at $1,633,305, approximately $776 per square foot. 32722 Folklore Loop is a home located in Alameda County with nearby schools including Tom Kitayama Elementary School, Cesar Chavez Middle School, and James Logan High School.
Ownership History
Date
Name
Owned For
Owner Type
Purchase Details
Closed on
May 25, 2007
Sold by
Chow Andrew Y and Chow Irene A
Bought by
Chow Andrew Y and Chow Irene A
Current Estimated Value
Purchase Details
Closed on
Mar 10, 2003
Sold by
Chow Andrew Y
Bought by
Chow Andrew Y and Chow Irene A
Home Financials for this Owner
Home Financials are based on the most recent Mortgage that was taken out on this home.
Original Mortgage
$275,000
Interest Rate
5.82%
Purchase Details
Closed on
Nov 9, 1998
Sold by
Kaufman & Broad South Bay Inc
Bought by
Chow Andrew Y
Home Financials for this Owner
Home Financials are based on the most recent Mortgage that was taken out on this home.
Original Mortgage
$288,850
Interest Rate
6.54%
Create a Home Valuation Report for This Property
The Home Valuation Report is an in-depth analysis detailing your home's value as well as a comparison with similar homes in the area
Home Values in the Area
Average Home Value in this Area
Purchase History
| Date | Buyer | Sale Price | Title Company |
|---|---|---|---|
| Chow Andrew Y | -- | None Available | |
| Chow Andrew Y | -- | Chicago Title Company | |
| Chow Andrew Y | $361,500 | First American Title Guarant |
Source: Public Records
Mortgage History
| Date | Status | Borrower | Loan Amount |
|---|---|---|---|
| Previous Owner | Chow Andrew Y | $275,000 | |
| Previous Owner | Chow Andrew Y | $288,850 |
Source: Public Records
Tax History
| Year | Tax Paid | Tax Assessment Tax Assessment Total Assessment is a certain percentage of the fair market value that is determined by local assessors to be the total taxable value of land and additions on the property. | Land | Improvement |
|---|---|---|---|---|
| 2025 | $8,389 | $559,067 | $169,773 | $396,294 |
| 2024 | $8,389 | $547,970 | $166,445 | $388,525 |
| 2023 | $8,105 | $544,090 | $163,182 | $380,908 |
| 2022 | $7,955 | $526,423 | $159,982 | $373,441 |
| 2021 | $7,777 | $515,966 | $156,846 | $366,120 |
| 2020 | $7,616 | $517,604 | $155,238 | $362,366 |
| 2019 | $7,684 | $507,457 | $152,195 | $355,262 |
| 2018 | $7,504 | $497,508 | $149,211 | $348,297 |
| 2017 | $7,323 | $487,755 | $146,286 | $341,469 |
| 2016 | $7,058 | $478,193 | $143,418 | $334,775 |
| 2015 | $6,922 | $471,011 | $141,264 | $329,747 |
| 2014 | $6,662 | $461,785 | $138,497 | $323,288 |
Source: Public Records
Map
Nearby Homes
- 2116 Sunsprite Dr
- 32651 Singh Cir
- 32656 Brenda Way Unit 2
- 32224 Sloccum Ct
- 32625 Brenda Way Unit 1
- 2473 Balmoral St
- 32262 Crest Ln
- 179 Kona Cir
- 23 Palm Dr
- 426 Honolulu Cir
- 30 Palm Dr Unit 30
- 3020 San Andreas Dr
- 418 Fiji Cir Unit 418
- 259 Molokai Cir Unit 259
- 2523 Copa Del Oro Dr
- 43 Palm Dr
- 269 Oahu Cir
- 33479 Alvarado Niles Rd
- 31262 San Andreas Dr
- 33010 Lake Mead Dr
- 32730 Folklore Loop
- 32714 Folklore Loop
- 32717 Mirabella Dr
- 32738 Folklore Loop
- 32706 Folklore Loop
- 32709 Mirabella Dr
- 32725 Mirabella Dr
- 32701 Mirabella Dr
- 32733 Mirabella Dr
- 32723 Folklore Loop
- 32715 Folklore Loop
- 32731 Folklore Loop
- 32746 Folklore Loop
- 32707 Folklore Loop
- 32739 Folklore Loop
- 32741 Mirabella Dr
- 32754 Folklore Loop
- 32747 Folklore Loop
- 1940 Abreu Way
- 32749 Mirabella Dr
Your Personal Tour Guide
Ask me questions while you tour the home.