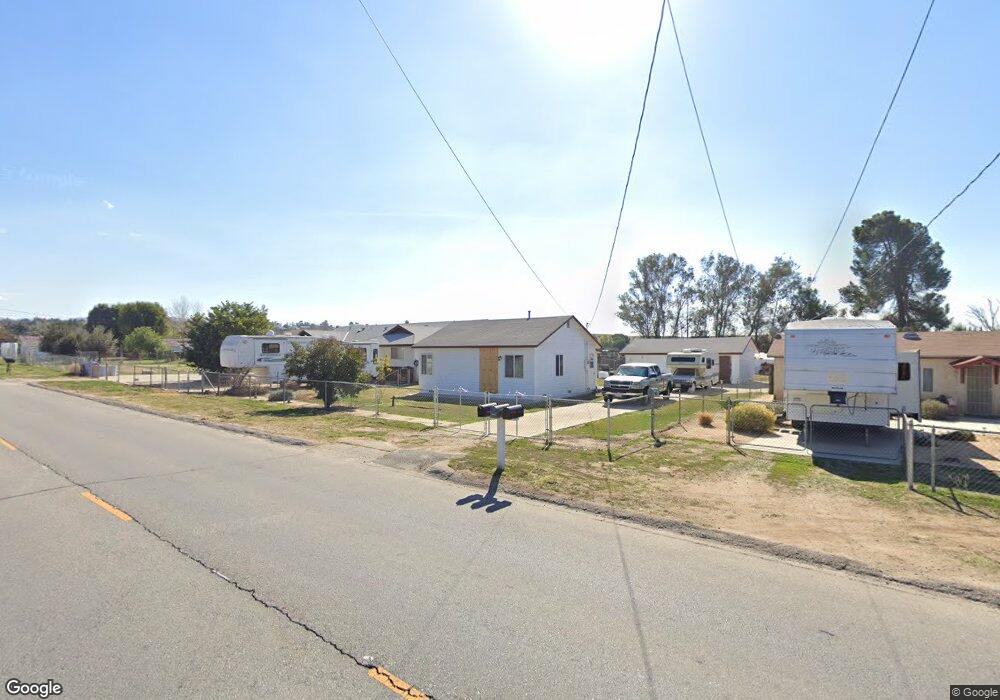
32733 Avenue E Yucaipa, CA 92399
Estimated Value: $368,000 - $448,000
2
Beds
1
Bath
844
Sq Ft
$478/Sq Ft
Est. Value
About This Home
This home is located at 32733 Avenue E, Yucaipa, CA 92399 and is currently estimated at $403,283, approximately $477 per square foot. 32733 Avenue E is a home located in San Bernardino County with nearby schools including Dunlap Elementary, Park View Middle School, and Yucaipa High School.
Create a Home Valuation Report for This Property
The Home Valuation Report is an in-depth analysis detailing your home's value as well as a comparison with similar homes in the area
Home Values in the Area
Average Home Value in this Area
Tax History
| Year | Tax Paid | Tax Assessment Tax Assessment Total Assessment is a certain percentage of the fair market value that is determined by local assessors to be the total taxable value of land and additions on the property. | Land | Improvement |
|---|---|---|---|---|
| 2025 | $847 | $34,312 | $6,879 | $27,433 |
| 2024 | $827 | $33,639 | $6,744 | $26,895 |
| 2023 | $756 | $32,980 | $6,612 | $26,368 |
| 2022 | $728 | $32,333 | $6,482 | $25,851 |
| 2021 | $706 | $31,699 | $6,355 | $25,344 |
| 2020 | $698 | $31,374 | $6,290 | $25,084 |
| 2019 | $427 | $30,759 | $6,167 | $24,592 |
| 2018 | $418 | $30,156 | $6,046 | $24,110 |
| 2017 | $410 | $29,564 | $5,927 | $23,637 |
| 2016 | $405 | $28,985 | $5,811 | $23,174 |
| 2015 | $401 | $28,550 | $5,724 | $22,826 |
| 2014 | $394 | $27,991 | $5,612 | $22,379 |
Source: Public Records
Map
Nearby Homes
- 32797 Avenue D
- 32533 Avenue E
- 12915 14th St
- 32390 Avenue D
- 32276 Kentucky St
- 33155 Avenue D
- 0 Calimesa Blvd Unit IG25119291
- 33241 Avenue D
- 32237 Yucaipa Blvd
- 0 Tennessee St Unit IG26040424
- 0 Tennessee St Unit OC26011524
- 11967 Southwind Way
- 33467 Washington Dr
- 33345 Wallace Way
- 31976 Linda Ladera St
- 0 Live Oak Canyon Rd Unit IG25118771
- 31816 Avenue E Unit 16
- 31816 Avenue E Unit 99
- 92399 Yucaipa Blvd
- 33379 Wallace Way
Your Personal Tour Guide
Ask me questions while you tour the home.