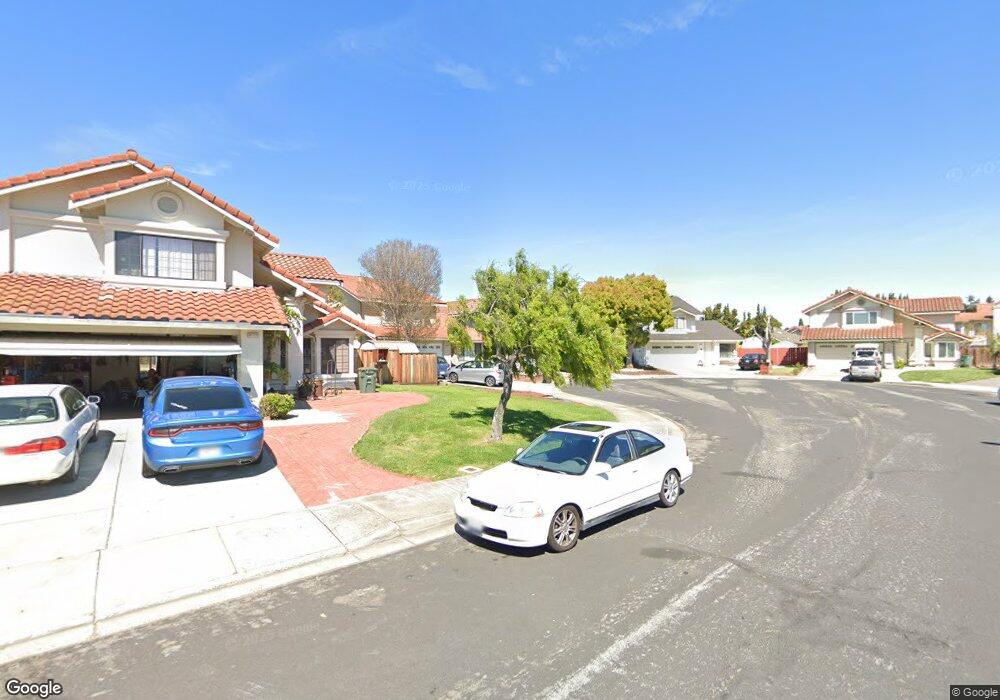
32745 Fullerton Ct Union City, CA 94587
Alvarado NeighborhoodEstimated Value: $1,491,000 - $1,602,279
3
Beds
3
Baths
1,683
Sq Ft
$910/Sq Ft
Est. Value
About This Home
This home is located at 32745 Fullerton Ct, Union City, CA 94587 and is currently estimated at $1,530,820, approximately $909 per square foot. 32745 Fullerton Ct is a home located in Alameda County with nearby schools including Pioneer Elementary School, Itliong-Vera Cruz, and James Logan High School.
Ownership History
Date
Name
Owned For
Owner Type
Purchase Details
Closed on
May 19, 2025
Sold by
Sutar Najim Ramjan and Belim Saniya Ashraf
Bought by
Najim Ramjan Sutar And Saniya Ashraf Belim Re and Sutar
Current Estimated Value
Purchase Details
Closed on
Nov 5, 2018
Sold by
Wenn Mark J
Bought by
Sutar Najim Ramjan and Belim Saniya Ashraf
Home Financials for this Owner
Home Financials are based on the most recent Mortgage that was taken out on this home.
Original Mortgage
$800,000
Interest Rate
4.5%
Mortgage Type
Adjustable Rate Mortgage/ARM
Purchase Details
Closed on
May 8, 2014
Sold by
Wenn Mark J
Bought by
Wenn Mark J
Home Financials for this Owner
Home Financials are based on the most recent Mortgage that was taken out on this home.
Original Mortgage
$417,000
Interest Rate
4.38%
Mortgage Type
New Conventional
Purchase Details
Closed on
Jan 11, 2010
Sold by
Wenn Shannon M
Bought by
Wenn Mark J
Purchase Details
Closed on
Jan 23, 1996
Sold by
Wenn Anastasia Jane
Bought by
Wenn Mark Joseph
Create a Home Valuation Report for This Property
The Home Valuation Report is an in-depth analysis detailing your home's value as well as a comparison with similar homes in the area
Home Values in the Area
Average Home Value in this Area
Purchase History
| Date | Buyer | Sale Price | Title Company |
|---|---|---|---|
| Najim Ramjan Sutar And Saniya Ashraf Belim Re | -- | None Listed On Document | |
| Sutar Najim Ramjan | $1,000,000 | Chicago Title Company | |
| Wenn Mark J | -- | Orange Coast Title Company | |
| Wenn Mark J | -- | None Available | |
| Wenn Mark Joseph | -- | -- |
Source: Public Records
Mortgage History
| Date | Status | Borrower | Loan Amount |
|---|---|---|---|
| Previous Owner | Sutar Najim Ramjan | $800,000 | |
| Previous Owner | Wenn Mark J | $417,000 |
Source: Public Records
Tax History Compared to Growth
Tax History
| Year | Tax Paid | Tax Assessment Tax Assessment Total Assessment is a certain percentage of the fair market value that is determined by local assessors to be the total taxable value of land and additions on the property. | Land | Improvement |
|---|---|---|---|---|
| 2025 | $15,003 | $1,115,500 | $334,650 | $780,850 |
| 2024 | $15,003 | $1,093,630 | $328,089 | $765,541 |
| 2023 | $14,550 | $1,072,190 | $321,657 | $750,533 |
| 2022 | $14,375 | $1,051,170 | $315,351 | $735,819 |
| 2021 | $14,000 | $1,030,560 | $309,168 | $721,392 |
| 2020 | $13,955 | $1,020,000 | $306,000 | $714,000 |
| 2019 | $13,870 | $1,000,000 | $300,000 | $700,000 |
| 2018 | $7,814 | $519,237 | $143,977 | $375,260 |
| 2017 | $7,650 | $509,059 | $141,155 | $367,904 |
| 2016 | $7,478 | $499,078 | $138,387 | $360,691 |
| 2015 | $7,386 | $491,582 | $136,309 | $355,273 |
| 2014 | $7,082 | $481,954 | $133,639 | $348,315 |
Source: Public Records
Map
Nearby Homes
- 4532 Delores Dr
- 4231 Hanford St
- 34102 Zaner Way
- 4272 Warbler Loop
- 4243 Comet Cir
- 32451 Regents Blvd
- 4611 Carmen Way
- 4639 Michelle Ct
- 4201 Saturn Way
- 4214 Saturn Way
- 4506 Birchwood Ct
- 32945 Regents Blvd
- 32542 Lake Tana St
- 4100 Aquarius Cir
- 33162 Lake Pyramid St
- 32409 Elizabeth Way
- 33018 Soquel St
- 4141 Deep Creek Rd Unit 137
- 33283 Sunriver Common
- 33228 Jamie Cir
- 32737 Fullerton Ct
- 32753 Fullerton Ct
- 32728 Gilroy Ct
- 32720 Gilroy Ct
- 32721 Fullerton Ct
- 32754 Fullerton Ct
- 32712 Gilroy Ct
- 4401 Holt St
- 4407 Holt St
- 32736 Gilroy Ct
- 4397 Holt St
- 4413 Holt St
- 32713 Fullerton Ct
- 32704 Gilroy Ct
- 4391 Holt St
- 32746 Fullerton Ct
- 4419 Holt St
- 32738 Fullerton Ct
- 4385 Holt St
- 4425 Holt St