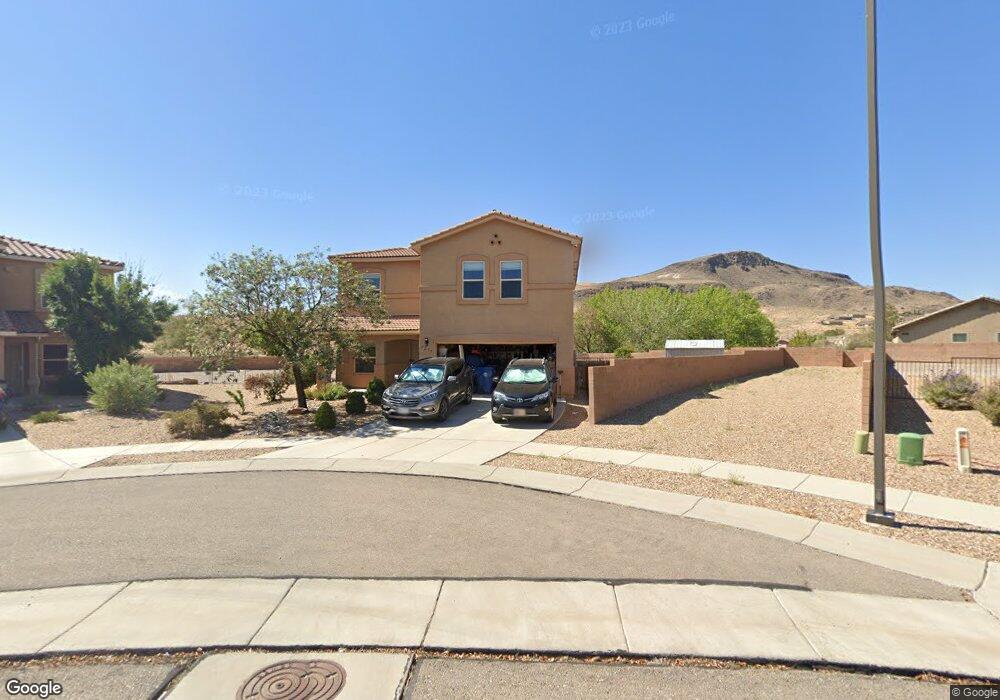
3275 Prairie Ridge Los Lunas, NM 87031
West Los Lunas NeighborhoodEstimated Value: $331,000 - $375,000
--
Bed
--
Bath
2,282
Sq Ft
$158/Sq Ft
Est. Value
About This Home
This home is located at 3275 Prairie Ridge, Los Lunas, NM 87031 and is currently estimated at $359,603, approximately $157 per square foot. 3275 Prairie Ridge is a home located in Valencia County with nearby schools including Sundance Elementary School, Los Lunas Middle School, and Los Lunas High School.
Ownership History
Date
Name
Owned For
Owner Type
Purchase Details
Closed on
Jul 2, 2021
Sold by
Long Robert E and Long Elizabeth
Bought by
Lal Apeksha and Lal Edwin Nilesh
Current Estimated Value
Home Financials for this Owner
Home Financials are based on the most recent Mortgage that was taken out on this home.
Original Mortgage
$210,000
Outstanding Balance
$190,129
Interest Rate
2.9%
Mortgage Type
New Conventional
Estimated Equity
$169,474
Purchase Details
Closed on
Nov 2, 2017
Sold by
Mcmonagle Elizabeth
Bought by
Long Robert E
Home Financials for this Owner
Home Financials are based on the most recent Mortgage that was taken out on this home.
Original Mortgage
$205,567
Interest Rate
3.83%
Mortgage Type
VA
Purchase Details
Closed on
Feb 15, 2011
Sold by
Centex Homes
Bought by
Long Robert E
Home Financials for this Owner
Home Financials are based on the most recent Mortgage that was taken out on this home.
Original Mortgage
$185,086
Interest Rate
4.79%
Mortgage Type
VA
Create a Home Valuation Report for This Property
The Home Valuation Report is an in-depth analysis detailing your home's value as well as a comparison with similar homes in the area
Home Values in the Area
Average Home Value in this Area
Purchase History
| Date | Buyer | Sale Price | Title Company |
|---|---|---|---|
| Lal Apeksha | -- | Fidelity National Ttl Ins Co | |
| Long Robert E | -- | None Available | |
| Long Robert E | -- | -- |
Source: Public Records
Mortgage History
| Date | Status | Borrower | Loan Amount |
|---|---|---|---|
| Open | Lal Apeksha | $210,000 | |
| Previous Owner | Long Robert E | $205,567 | |
| Previous Owner | Long Robert E | $185,086 |
Source: Public Records
Tax History Compared to Growth
Tax History
| Year | Tax Paid | Tax Assessment Tax Assessment Total Assessment is a certain percentage of the fair market value that is determined by local assessors to be the total taxable value of land and additions on the property. | Land | Improvement |
|---|---|---|---|---|
| 2024 | $3,188 | $96,296 | $14,629 | $81,667 |
| 2023 | $3,162 | $96,134 | $14,467 | $81,667 |
| 2022 | $3,110 | $93,334 | $11,667 | $81,667 |
| 2021 | $2,931 | $87,135 | $17,167 | $69,968 |
| 2020 | $2,696 | $84,597 | $16,667 | $67,930 |
| 2019 | $2,711 | $84,597 | $16,667 | $67,930 |
| 2018 | $2,664 | $84,593 | $10,927 | $73,666 |
| 2017 | $2,541 | $82,129 | $10,927 | $71,202 |
| 2016 | $2,464 | $79,737 | $10,927 | $68,810 |
| 2015 | -- | $77,415 | $10,927 | $66,488 |
| 2013 | -- | $72,971 | $10,927 | $62,044 |
| 2011 | -- | $212,538 | $31,827 | $180,711 |
Source: Public Records
Map
Nearby Homes
- 3271 Prairie Ridge St SW
- 3198 Prairie Ridge St SW
- 1100 Vista de Bosque SW
- 1200 Vista de Bosque SW
- Sandia Plan at The Trails at El Cerro
- Bandera Plan at The Trails at El Cerro
- Alameda Plan at The Trails at El Cerro
- Manzano Plan at The Trails at El Cerro
- 680 Purple Aster Ave SW
- 750 Creekside Ave SW
- Paloma Plan at The Bluffs at El Cerro
- Mariposa Plan at The Bluffs at El Cerro
- Aguila Plan at The Bluffs at El Cerro
- 3601 Santa fe Trail SW
- 3621 Santa fe Trail SW
- 3640 Santa fe Trail SW
- 3700 Santa fe Trail SW
- 760 Blue Sage Ave SW
- 1300 Vista de Bosque
- 1281 Vista de Bosque SW
- 3275 Prairie Ridge St SW
- 3273 Prairie Ridge St SW
- 3277 Prairie Ridge St SW
- 3277 Prairie Ridge
- 3277 Prairie Ridge
- 3271 Prairie Ridge
- 3291 Prairie Sage St SW
- 3279 Prairie Ridge
- 3281 Prairie Sage St SW
- 3269 Prairie Ridge St SW
- 3272 Prairie Ridge St SW
- 3283 Prairie Ridge
- 3283 Prairie Ridge
- 3283 Prairie Ridge St SW
- 3263 Prairie Ridge
- 3268 Prairie Ridge St
- 3261 Prairie Sage St SW
- 3284 Prairie Ridge
- 3295 Prairie Ridge St SW
- 3321 Prairie Sage St SW