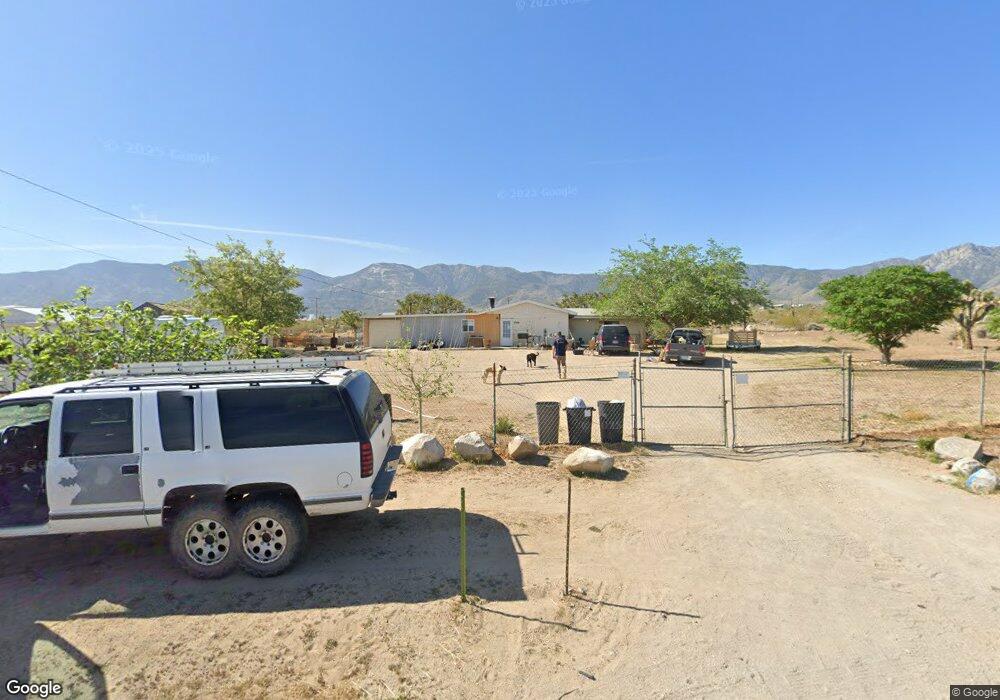
32775 Emerald Rd Lucerne Valley, CA 92356
Estimated Value: $270,740 - $349,000
2
Beds
2
Baths
1,490
Sq Ft
$198/Sq Ft
Est. Value
About This Home
This home is located at 32775 Emerald Rd, Lucerne Valley, CA 92356 and is currently estimated at $294,435, approximately $197 per square foot. 32775 Emerald Rd is a home located in San Bernardino County with nearby schools including Lucerne Valley Elementary School, Lucerne Valley Middle School, and Lucerne Valley High School.
Ownership History
Date
Name
Owned For
Owner Type
Purchase Details
Closed on
Oct 20, 2022
Sold by
Gumar Holdings Llc
Bought by
Dahlem Walter Darrell
Current Estimated Value
Purchase Details
Closed on
Feb 3, 2012
Sold by
Gurnee Margaret E
Bought by
Gumar Holdings Llc
Purchase Details
Closed on
Nov 30, 2009
Sold by
Gurnee Margaret
Bought by
Gurnee Margaret
Purchase Details
Closed on
Mar 10, 2000
Sold by
Dontcho Dusa
Bought by
Bonham Theodore Q
Purchase Details
Closed on
Dec 28, 1995
Sold by
Razsadin Katherine
Bought by
Cunningham Sina
Purchase Details
Closed on
Dec 18, 1995
Sold by
Cunningham Sina
Bought by
Razsadin Katherine
Purchase Details
Closed on
Mar 3, 1995
Sold by
Derebeew Konstantin and Derebeew Maria
Bought by
Romaniuk Zina and Razsadin Katherine
Create a Home Valuation Report for This Property
The Home Valuation Report is an in-depth analysis detailing your home's value as well as a comparison with similar homes in the area
Home Values in the Area
Average Home Value in this Area
Purchase History
| Date | Buyer | Sale Price | Title Company |
|---|---|---|---|
| Dahlem Walter Darrell | -- | -- | |
| Gumar Holdings Llc | -- | None Available | |
| Gurnee Margaret | -- | None Available | |
| Bonham Theodore Q | $70,000 | Commonwealth Land Title Co | |
| Cunningham Sina | -- | -- | |
| Razsadin Katherine | -- | -- | |
| Romaniuk Zina | -- | -- | |
| Razsadin Katherine | -- | -- | |
| Dontcho Dusa | -- | -- |
Source: Public Records
Tax History
| Year | Tax Paid | Tax Assessment Tax Assessment Total Assessment is a certain percentage of the fair market value that is determined by local assessors to be the total taxable value of land and additions on the property. | Land | Improvement |
|---|---|---|---|---|
| 2025 | $1,671 | $127,300 | $25,500 | $101,800 |
| 2024 | $1,719 | $132,600 | $26,520 | $106,080 |
| 2023 | $1,067 | $72,434 | $18,108 | $54,326 |
| 2022 | $1,043 | $71,014 | $17,753 | $53,261 |
| 2021 | $1,024 | $69,622 | $17,405 | $52,217 |
| 2020 | $1,010 | $68,909 | $17,227 | $51,682 |
| 2019 | $994 | $67,558 | $16,889 | $50,669 |
| 2018 | $822 | $66,233 | $16,558 | $49,675 |
| 2017 | $809 | $64,934 | $16,233 | $48,701 |
| 2016 | $793 | $63,661 | $15,915 | $47,746 |
| 2015 | $784 | $62,705 | $15,676 | $47,029 |
| 2014 | $775 | $61,477 | $15,369 | $46,108 |
Source: Public Records
Map
Nearby Homes
- 32786 Topaz Rd
- 7980 Crystal Creek Rd
- 0 No Name Unit IV24187306
- 32358 Emerald Rd
- 32361 Spinel Rd
- 32573 Azurite Rd
- 32224 Emerald Rd
- 32322 Richard St
- 721 Zircon Rd
- 0 Randell St
- 32 Amber Rd
- 0 Carnelian Rd Unit HD25149897
- 31875 Sapphire Rd
- 9125 Mesa Rd
- 0 Red Butte Rd Unit HD25225780
- 31633 Azurite Rd
- 728 Red Butte Rd
- 9372 Mesa Rd
- 0 0446032280000 Unit 25008617
- 9404 Mesa Rd
- 32727 Emerald Rd
- 32760 Emerald Rd
- 32772 Emerald Rd
- 32776 Emerald Rd
- 32827 Emerald Rd
- 32828 Emerald Rd
- 32839 Emerald Rd
- 32761 Sapphire Rd
- 32692 Emerald Rd
- 32731 Sapphire Rd
- 32793 Sapphire Rd
- 32723 Sapphire Rd
- 32693 Sapphire Rd
- 32842 Emerald Rd
- 8038 Crystal Creek Rd
- 32772 Sapphire Rd
- 32752 Sapphire Rd
- 32778 Sapphire Rd
- 7979 Sky High Ln
- 32720 Sapphire Rd
Your Personal Tour Guide
Ask me questions while you tour the home.