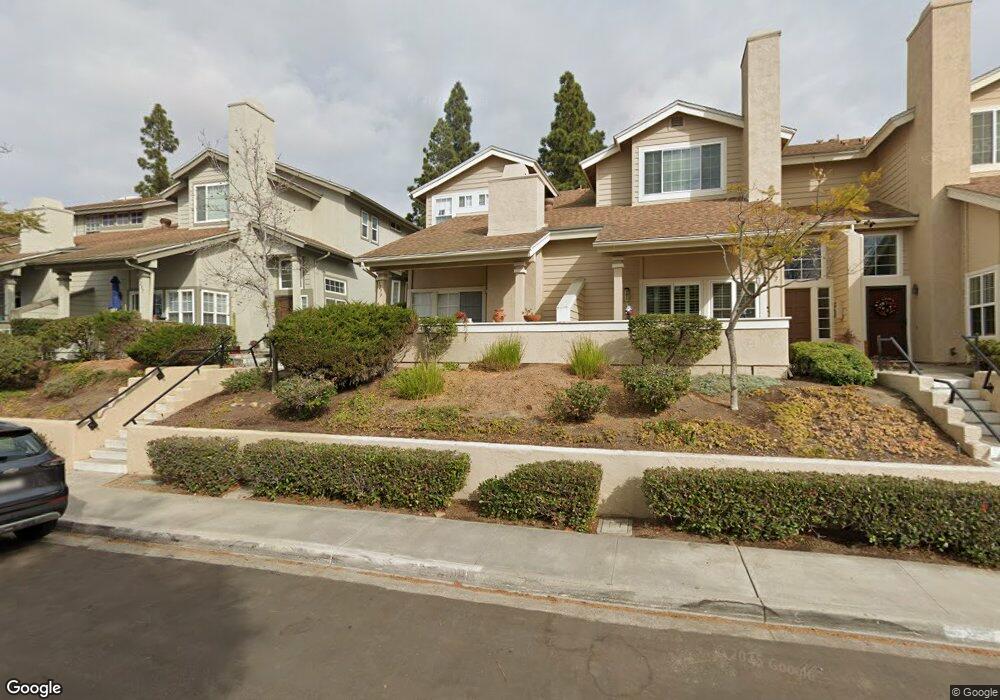
3279 E Fox Run Way San Diego, CA 92111
Clairemont Mesa West NeighborhoodEstimated Value: $821,895 - $915,000
2
Beds
3
Baths
1,468
Sq Ft
$580/Sq Ft
Est. Value
About This Home
This home is located at 3279 E Fox Run Way, San Diego, CA 92111 and is currently estimated at $850,724, approximately $579 per square foot. 3279 E Fox Run Way is a home located in San Diego County with nearby schools including Holmes Elementary, Marston Middle School, and Clairemont High School.
Ownership History
Date
Name
Owned For
Owner Type
Purchase Details
Closed on
Apr 4, 2009
Sold by
Avila James E and Avila Julie A
Bought by
Avila James E and Avila Julie A
Current Estimated Value
Purchase Details
Closed on
May 18, 2004
Sold by
Avila James E and Avila Julie A
Bought by
Avila James E and Avila Julie A
Purchase Details
Closed on
Jan 30, 2001
Sold by
Kimball Family Trust 11-08-98 and Bryan D
Bought by
Avila James E and Avila Julie A
Home Financials for this Owner
Home Financials are based on the most recent Mortgage that was taken out on this home.
Original Mortgage
$218,400
Outstanding Balance
$79,125
Interest Rate
7.12%
Estimated Equity
$771,599
Purchase Details
Closed on
Nov 8, 1998
Sold by
Kimball Bryan D and Kimball Leslie M
Bought by
Kimball Bryan D and Kimball Leslie M
Purchase Details
Closed on
Dec 3, 1985
Purchase Details
Closed on
Apr 30, 1984
Create a Home Valuation Report for This Property
The Home Valuation Report is an in-depth analysis detailing your home's value as well as a comparison with similar homes in the area
Home Values in the Area
Average Home Value in this Area
Purchase History
| Date | Buyer | Sale Price | Title Company |
|---|---|---|---|
| Avila James E | -- | None Available | |
| Avila James E | -- | None Available | |
| Avila James E | -- | -- | |
| Avila James E | $274,000 | United Title | |
| Kimball Bryan D | -- | -- | |
| -- | $122,500 | -- | |
| -- | $107,000 | -- |
Source: Public Records
Mortgage History
| Date | Status | Borrower | Loan Amount |
|---|---|---|---|
| Open | Avila James E | $218,400 | |
| Closed | Avila James E | $40,950 |
Source: Public Records
Tax History Compared to Growth
Tax History
| Year | Tax Paid | Tax Assessment Tax Assessment Total Assessment is a certain percentage of the fair market value that is determined by local assessors to be the total taxable value of land and additions on the property. | Land | Improvement |
|---|---|---|---|---|
| 2025 | $4,898 | $411,342 | $180,809 | $230,533 |
| 2024 | $4,898 | $403,277 | $177,264 | $226,013 |
| 2023 | $4,789 | $395,371 | $173,789 | $221,582 |
| 2022 | $4,660 | $387,620 | $170,382 | $217,238 |
| 2021 | $4,627 | $380,021 | $167,042 | $212,979 |
| 2020 | $4,570 | $376,126 | $165,330 | $210,796 |
| 2019 | $4,487 | $368,752 | $162,089 | $206,663 |
| 2018 | $4,194 | $361,522 | $158,911 | $202,611 |
| 2017 | $4,093 | $354,435 | $155,796 | $198,639 |
| 2016 | $4,026 | $347,487 | $152,742 | $194,745 |
| 2015 | $3,966 | $342,268 | $150,448 | $191,820 |
| 2014 | $3,902 | $335,564 | $147,501 | $188,063 |
Source: Public Records
Map
Nearby Homes
- 3226 Old Heather Rd
- 3710 Old Cobble Rd
- 3270 W Fox Run Way Unit 2
- 5631 Mount Acara Dr
- 3405 Aveley Place
- 3561 Accomac Ave
- 3635 Mount Abbey Ave
- 3526 Mount Abbey Ave
- 3602 Mount Acadia Blvd
- 6929 Park Mesa Way Unit 126
- 7045 Beagle St
- 6939 Park Mesa Way Unit 117
- 2868-70 Preece St
- 7016 Park Mesa Way Unit 29
- 3942 Mount Acadia Blvd
- 2818 Nye St
- 3432 Mount Ariane Dr
- 2750 Wheatstone St Unit 153
- 2750 Wheatstone St Unit 113
- 2750 Wheatstone St Unit 203
- 3277 E Fox Run Way
- 3285 E Fox Run Way Unit 3
- 3275 E Fox Run Way
- 3287 E Fox Run Way
- 3269 E Fox Run Way
- 3289 E Fox Run Way
- 3212 Old Bridgeport Way
- 3267 E Fox Run Way
- 3210 Old Bridgeport Way
- 3295 E Fox Run Way
- 3208 Old Bridgeport Way
- 3206 Old Bridgeport Way
- 3265 E Fox Run Way
- 3220 Old Bridgeport Way
- 3297 E Fox Run Way
- 3284 E Fox Run Way
- 3222 Old Bridgeport Way
- 3296 E Fox Run Way
- 3290 E Fox Run Way
- 3278 E Fox Run Way Unit 2