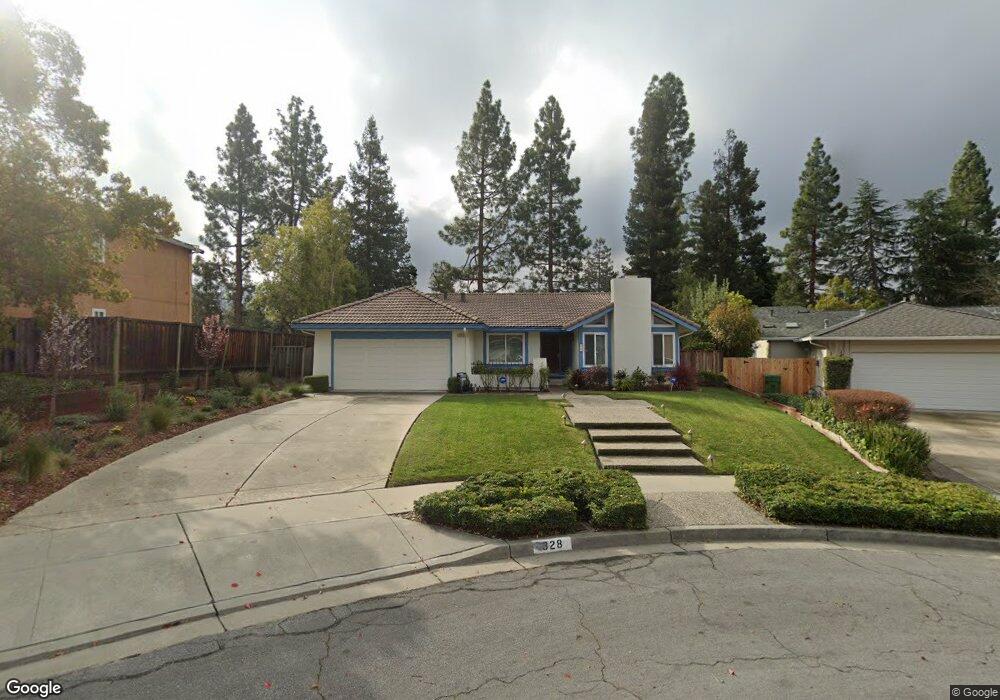
328 Bryant Ct Fremont, CA 94539
Mission San Jose NeighborhoodEstimated Value: $1,937,623 - $2,496,000
3
Beds
2
Baths
1,721
Sq Ft
$1,343/Sq Ft
Est. Value
About This Home
This home is located at 328 Bryant Ct, Fremont, CA 94539 and is currently estimated at $2,311,156, approximately $1,342 per square foot. 328 Bryant Ct is a home located in Alameda County with nearby schools including Mission San Jose Elementary School, William Hopkins Junior High School, and Mission San Jose High School.
Ownership History
Date
Name
Owned For
Owner Type
Purchase Details
Closed on
Apr 28, 2008
Sold by
Nathwani Saroj
Bought by
Nathwani Kishore M
Current Estimated Value
Purchase Details
Closed on
Nov 8, 2002
Sold by
Chen Jason and Lai Elaine
Bought by
Nathwani Kishore M and Nathwani Saroj
Home Financials for this Owner
Home Financials are based on the most recent Mortgage that was taken out on this home.
Original Mortgage
$430,000
Interest Rate
5.12%
Purchase Details
Closed on
Dec 20, 2001
Sold by
Chen Jason and Lai Elaine
Bought by
Chen Jason and Lai Elaine
Purchase Details
Closed on
Dec 4, 1999
Sold by
Chen Jason and Lai Elaine
Bought by
Chen Jason and Lai Elaine
Purchase Details
Closed on
Apr 23, 1998
Sold by
Siegner Gary and Siegner Pat
Bought by
Chen Jason and Lai Elaine
Home Financials for this Owner
Home Financials are based on the most recent Mortgage that was taken out on this home.
Original Mortgage
$363,600
Interest Rate
6.75%
Create a Home Valuation Report for This Property
The Home Valuation Report is an in-depth analysis detailing your home's value as well as a comparison with similar homes in the area
Home Values in the Area
Average Home Value in this Area
Purchase History
| Date | Buyer | Sale Price | Title Company |
|---|---|---|---|
| Nathwani Kishore M | -- | None Available | |
| Nathwani Kishore M | $682,500 | First American Title | |
| Chen Jason | -- | Fidelity National Title Co | |
| Chen Jason | -- | -- | |
| Chen Jason | $454,500 | American Title Co |
Source: Public Records
Mortgage History
| Date | Status | Borrower | Loan Amount |
|---|---|---|---|
| Previous Owner | Nathwani Kishore M | $430,000 | |
| Previous Owner | Chen Jason | $363,600 | |
| Closed | Nathwani Kishore M | $100,000 |
Source: Public Records
Tax History Compared to Growth
Tax History
| Year | Tax Paid | Tax Assessment Tax Assessment Total Assessment is a certain percentage of the fair market value that is determined by local assessors to be the total taxable value of land and additions on the property. | Land | Improvement |
|---|---|---|---|---|
| 2025 | $11,855 | $993,038 | $296,591 | $696,447 |
| 2024 | $11,855 | $973,571 | $290,777 | $682,794 |
| 2023 | $11,542 | $954,487 | $285,077 | $669,410 |
| 2022 | $11,400 | $935,774 | $279,488 | $656,286 |
| 2021 | $11,120 | $917,432 | $274,010 | $643,422 |
| 2020 | $11,171 | $908,031 | $271,202 | $636,829 |
| 2019 | $11,043 | $890,230 | $265,885 | $624,345 |
| 2018 | $10,829 | $872,779 | $260,673 | $612,106 |
| 2017 | $10,513 | $851,670 | $255,563 | $596,107 |
| 2016 | $10,338 | $834,976 | $250,554 | $584,422 |
| 2015 | $10,205 | $822,439 | $246,792 | $575,647 |
| 2014 | $10,033 | $806,331 | $241,958 | $564,373 |
Source: Public Records
Map
Nearby Homes
- 483 Becado Place
- 43547 Ellsworth St
- 646 Bella Vista Ct
- 341 Dana St
- 636 Praderia Cir
- 905 Glenhill Dr
- 1298 Ocaso Camino
- 379 Felipe Common
- 42099 Vinha Way
- 43150 Starr St
- 43555 Puesta Del Sol
- 44423 View Point Cir
- 138 Telles Ln
- 335 Via Rosario
- 42965 Corte Verde
- 42955 Corte Verde
- 124 Linmore Dr
- 2164 Ocaso Camino
- 2450 Euclid Place
- 42226 Camino Santa Barbara