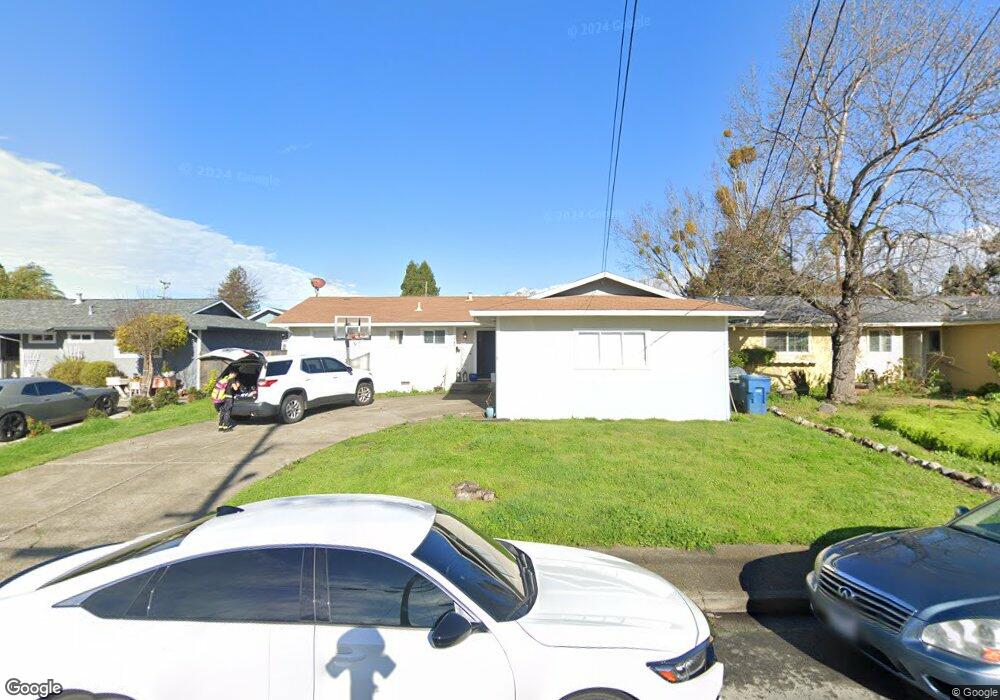
328 Burton Ave Rohnert Park, CA 94928
Estimated Value: $578,233 - $652,000
3
Beds
2
Baths
1,200
Sq Ft
$515/Sq Ft
Est. Value
About This Home
This home is located at 328 Burton Ave, Rohnert Park, CA 94928 and is currently estimated at $617,808, approximately $514 per square foot. 328 Burton Ave is a home located in Sonoma County with nearby schools including Rancho Cotate High School, Cross & Crown Lutheran School, and Bridghaven.
Ownership History
Date
Name
Owned For
Owner Type
Purchase Details
Closed on
Dec 15, 2016
Sold by
Griffith Harold Robert and Griffith Amber F
Bought by
Griffith Family Trust and Griffith
Current Estimated Value
Purchase Details
Closed on
Mar 16, 2012
Sold by
U S Bank National Association
Bought by
Breuer Louis and Griffith Karen
Purchase Details
Closed on
Dec 7, 2011
Sold by
Vaneps Michael
Bought by
U S Bank National Association
Purchase Details
Closed on
Dec 23, 2002
Sold by
Vaneps Michael and Vaneps Erin
Bought by
Vaneps Michael
Home Financials for this Owner
Home Financials are based on the most recent Mortgage that was taken out on this home.
Original Mortgage
$252,800
Interest Rate
6.99%
Purchase Details
Closed on
Apr 24, 1998
Sold by
Hart Alan
Bought by
Vaneps Michael and Vaneps Erin
Home Financials for this Owner
Home Financials are based on the most recent Mortgage that was taken out on this home.
Original Mortgage
$128,000
Interest Rate
7.06%
Create a Home Valuation Report for This Property
The Home Valuation Report is an in-depth analysis detailing your home's value as well as a comparison with similar homes in the area
Home Values in the Area
Average Home Value in this Area
Purchase History
| Date | Buyer | Sale Price | Title Company |
|---|---|---|---|
| Griffith Family Trust | -- | None Listed On Document | |
| Breuer Louis | $202,500 | Fidelity National Title Co | |
| U S Bank National Association | $190,463 | Servicelink | |
| Vaneps Michael | -- | North American Title Co | |
| Vaneps Michael | $160,000 | First American Title |
Source: Public Records
Mortgage History
| Date | Status | Borrower | Loan Amount |
|---|---|---|---|
| Previous Owner | Vaneps Michael | $252,800 | |
| Previous Owner | Vaneps Michael | $128,000 |
Source: Public Records
Tax History Compared to Growth
Tax History
| Year | Tax Paid | Tax Assessment Tax Assessment Total Assessment is a certain percentage of the fair market value that is determined by local assessors to be the total taxable value of land and additions on the property. | Land | Improvement |
|---|---|---|---|---|
| 2025 | $2,978 | $254,025 | $101,734 | $152,291 |
| 2024 | $2,978 | $249,045 | $99,740 | $149,305 |
| 2023 | $2,978 | $244,163 | $97,785 | $146,378 |
| 2022 | $2,920 | $239,376 | $95,868 | $143,508 |
| 2021 | $2,896 | $234,684 | $93,989 | $140,695 |
| 2020 | $2,937 | $232,279 | $93,026 | $139,253 |
| 2019 | $2,899 | $227,725 | $91,202 | $136,523 |
| 2018 | $2,844 | $223,261 | $89,414 | $133,847 |
| 2017 | $2,797 | $218,884 | $87,661 | $131,223 |
| 2016 | $2,679 | $214,593 | $85,943 | $128,650 |
| 2015 | $2,614 | $211,371 | $84,653 | $126,718 |
| 2014 | $2,596 | $207,231 | $82,995 | $124,236 |
Source: Public Records
Map
Nearby Homes
- 359 Bonnie Ave
- 368 Bonnie Ct
- 8175 Arthur St
- 293 Lincoln Ave
- 8034 Adrian Dr
- 7449 Adrian Dr
- 461 Lincoln Ave
- 101 Pinewood Ct
- 8440 Lasalle Ave
- 219 College View Dr
- 8020 Beverly Dr
- 7530 Bernice Ave
- 11 Ramble Creek Dr
- 105 Nicholas Ct
- 121 Forno Way
- 218 W Cotati Ave
- 746 Bernadette Ave
- 152 Valparaiso Ave
- 8484 Lancaster Dr
- 220 Mendelssohn Ct