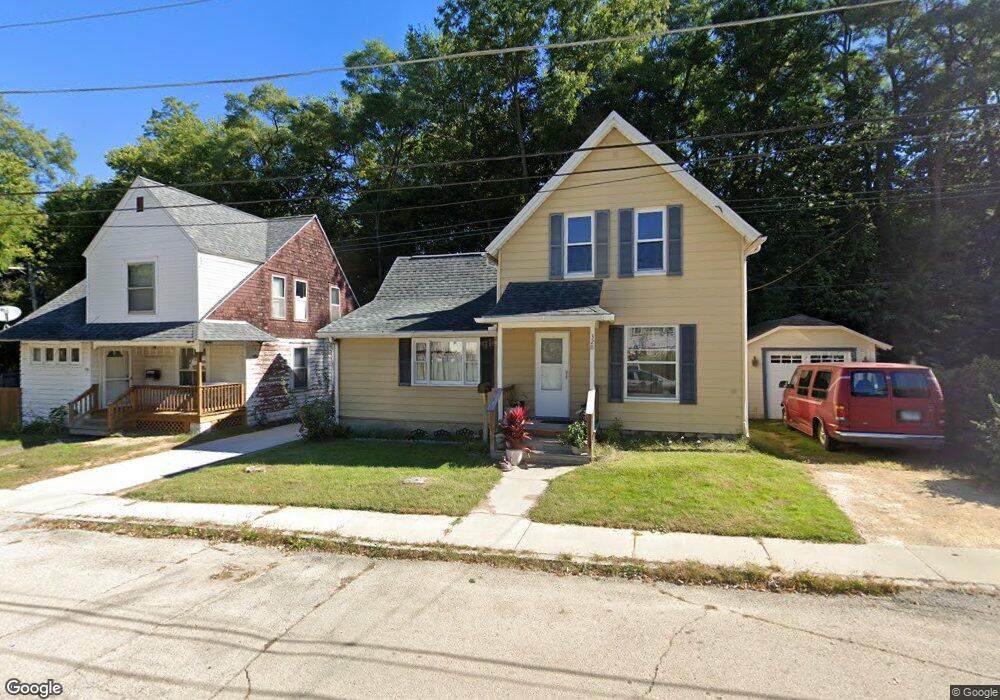
328 Central Place Dixon, IL 61021
South Dixon NeighborhoodEstimated Value: $87,000 - $107,000
2
Beds
2
Baths
1,280
Sq Ft
$74/Sq Ft
Est. Value
About This Home
This home is located at 328 Central Place, Dixon, IL 61021 and is currently estimated at $94,228, approximately $73 per square foot. 328 Central Place is a home located in Lee County with nearby schools including Washington Elementary School, Madison Elementary School, and Jefferson Elementary School.
Ownership History
Date
Name
Owned For
Owner Type
Purchase Details
Closed on
May 19, 2021
Sold by
Helfrich Charles Humphrey
Bought by
Hinrichs Kyle
Current Estimated Value
Home Financials for this Owner
Home Financials are based on the most recent Mortgage that was taken out on this home.
Original Mortgage
$69,714
Outstanding Balance
$62,980
Interest Rate
2.9%
Mortgage Type
FHA
Estimated Equity
$31,248
Purchase Details
Closed on
Oct 28, 2020
Sold by
Lakeview Loan Servicing Llc
Bought by
Helfrich Charles Humphrey
Purchase Details
Closed on
Sep 30, 2020
Sold by
Lee County Sheriff
Bought by
Lakeview Loan Servicing Llc
Purchase Details
Closed on
Sep 15, 2010
Sold by
Floray Jeffry A
Bought by
Floray Jeffry A and Floray Amy K
Home Financials for this Owner
Home Financials are based on the most recent Mortgage that was taken out on this home.
Original Mortgage
$50,162
Interest Rate
5.37%
Mortgage Type
FHA
Create a Home Valuation Report for This Property
The Home Valuation Report is an in-depth analysis detailing your home's value as well as a comparison with similar homes in the area
Home Values in the Area
Average Home Value in this Area
Purchase History
| Date | Buyer | Sale Price | Title Company |
|---|---|---|---|
| Hinrichs Kyle | $71,000 | None Available | |
| Helfrich Charles Humphrey | $20,000 | None Available | |
| Lakeview Loan Servicing Llc | -- | None Available | |
| Lakeview Loan Servicing Llc | -- | None Available | |
| Floray Jeffry A | -- | None Available |
Source: Public Records
Mortgage History
| Date | Status | Borrower | Loan Amount |
|---|---|---|---|
| Open | Hinrichs Kyle | $69,714 | |
| Previous Owner | Floray Jeffry A | $50,162 |
Source: Public Records
Tax History Compared to Growth
Tax History
| Year | Tax Paid | Tax Assessment Tax Assessment Total Assessment is a certain percentage of the fair market value that is determined by local assessors to be the total taxable value of land and additions on the property. | Land | Improvement |
|---|---|---|---|---|
| 2024 | $2,110 | $23,034 | $3,249 | $19,785 |
| 2023 | $1,964 | $21,132 | $2,981 | $18,151 |
| 2022 | $1,246 | $19,038 | $2,686 | $16,352 |
| 2021 | $1,702 | $17,628 | $2,487 | $15,141 |
| 2020 | $1,639 | $16,789 | $2,369 | $14,420 |
| 2019 | $1,752 | $17,850 | $2,346 | $15,504 |
| 2018 | $1,176 | $17,500 | $2,300 | $15,200 |
| 2017 | $1,107 | $17,510 | $2,266 | $15,244 |
| 2016 | $1,125 | $17,634 | $2,743 | $14,891 |
| 2015 | $1,078 | $17,634 | $2,743 | $14,891 |
| 2014 | $1,060 | $17,634 | $2,743 | $14,891 |
| 2013 | $1,070 | $18,000 | $2,800 | $15,200 |
Source: Public Records
Map
Nearby Homes
- 913 W 4th St
- 719 W 2nd St
- 717 Madison Ave
- 1213 W 4th St
- 522 S Hennepin Ave
- 802 S Peoria Ave
- 321 S Ottawa Ave
- 69 S Ottawa Ave
- 1510 W 2nd St
- 712 S Ottawa Ave
- 1611 W 3rd St
- 316 E 3rd St
- 1017 S Galena Ave
- 1603 Riverside Cir
- 1613 Riverside Cir
- 603 S Dixon Ave
- 105 S Dement Ave
- 1216 S Ottawa Ave
- 1104 Hemlock Ave
- 318 N Galena Ave
- 402 Central Place
- 326 Central Place
- 327 Central Place
- 403 Central Place
- 325 Central Place
- 408 Central Place
- 407 Central Place
- 316 Central Place
- 323 Central Place
- 401 Monroe Ave Unit A
- 321 Monroe Ave
- 312 Central Place
- 317 Monroe Ave
- 411 Monroe Ave
- 315 Monroe Ave
- 403 Monroe Ave
- 406 Depot Ave
- 311 Monroe Ave
- 417 Monroe Ave
- 306 Central Place