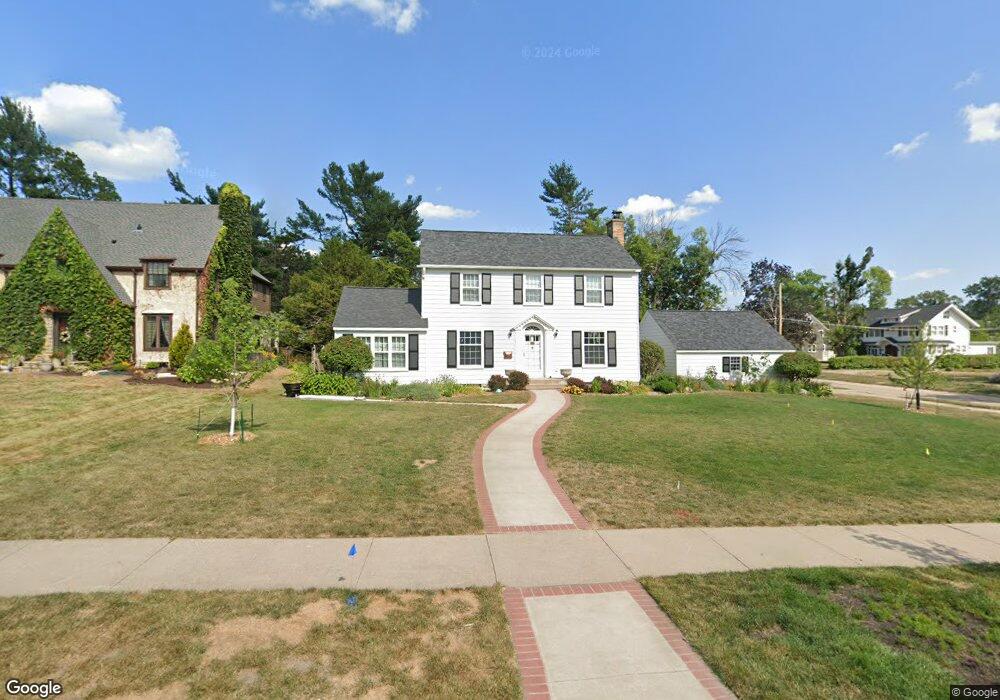
328 Crescent St SE Cedar Rapids, IA 52403
Bever Park NeighborhoodEstimated Value: $320,000 - $371,000
3
Beds
2
Baths
1,955
Sq Ft
$174/Sq Ft
Est. Value
About This Home
This home is located at 328 Crescent St SE, Cedar Rapids, IA 52403 and is currently estimated at $339,465, approximately $173 per square foot. 328 Crescent St SE is a home located in Linn County with nearby schools including Johnson STEAM Academy, McKinley STEAM Academy, and George Washington High School.
Ownership History
Date
Name
Owned For
Owner Type
Purchase Details
Closed on
Jan 21, 2014
Sold by
Barton Ryan C and Barton Mackenzie
Bought by
Dewolf Brandon C and Dewolf Tara A
Current Estimated Value
Home Financials for this Owner
Home Financials are based on the most recent Mortgage that was taken out on this home.
Original Mortgage
$239,400
Outstanding Balance
$181,494
Interest Rate
4.5%
Mortgage Type
New Conventional
Estimated Equity
$157,971
Purchase Details
Closed on
May 29, 2005
Sold by
Virden Timothy J and Virden Katherine M
Bought by
Barton Ryan C and Barton Mackenzie
Home Financials for this Owner
Home Financials are based on the most recent Mortgage that was taken out on this home.
Original Mortgage
$180,000
Interest Rate
5.91%
Mortgage Type
Fannie Mae Freddie Mac
Create a Home Valuation Report for This Property
The Home Valuation Report is an in-depth analysis detailing your home's value as well as a comparison with similar homes in the area
Home Values in the Area
Average Home Value in this Area
Purchase History
| Date | Buyer | Sale Price | Title Company |
|---|---|---|---|
| Dewolf Brandon C | $252,000 | None Available | |
| Barton Ryan C | $224,500 | -- |
Source: Public Records
Mortgage History
| Date | Status | Borrower | Loan Amount |
|---|---|---|---|
| Open | Dewolf Brandon C | $239,400 | |
| Previous Owner | Barton Ryan C | $180,000 |
Source: Public Records
Tax History Compared to Growth
Tax History
| Year | Tax Paid | Tax Assessment Tax Assessment Total Assessment is a certain percentage of the fair market value that is determined by local assessors to be the total taxable value of land and additions on the property. | Land | Improvement |
|---|---|---|---|---|
| 2025 | $5,688 | $347,900 | $96,700 | $251,200 |
| 2024 | $5,824 | $331,900 | $96,700 | $235,200 |
| 2023 | $5,824 | $331,900 | $96,700 | $235,200 |
| 2022 | $5,524 | $285,000 | $92,100 | $192,900 |
| 2021 | $5,750 | $275,600 | $92,100 | $183,500 |
| 2020 | $5,750 | $269,200 | $92,100 | $177,100 |
| 2019 | $5,580 | $267,400 | $92,100 | $175,300 |
| 2018 | $5,422 | $267,400 | $92,100 | $175,300 |
| 2017 | $5,583 | $272,000 | $92,100 | $179,900 |
| 2016 | $5,583 | $262,700 | $92,100 | $170,600 |
| 2015 | $5,355 | $251,653 | $92,085 | $159,568 |
| 2014 | $5,170 | $251,653 | $92,085 | $159,568 |
| 2013 | $5,054 | $251,653 | $92,085 | $159,568 |
Source: Public Records
Map
Nearby Homes
- 330 Crescent St SE
- 2020 Grande Ave SE
- 2144 Grande Ave SE
- 1949 Park Ave SE
- 1830 Grande Ave SE
- 1821 Ridgewood Terrace SE
- 371 20th St SE
- 1813 3rd Ave SE
- 2241 Linden Dr SE
- 1953 2nd Ave SE
- 1801 Blake Blvd SE
- 1816 Park Ave SE
- 361 19th St SE
- 1831 2nd Ave SE
- 1727 Grande Ave SE
- 1730 Park Ave SE
- 2251 Bever Ave SE
- 1953 1st Ave E Unit 301
- 1953 1st Ave SE Unit 301
- 1953 1st Ave SE Unit 503
- 2110 Blake Blvd SE
- 324 Crescent St SE
- 320 Crescent St SE
- 327 Crescent St SE
- 2111 Blake Blvd SE
- 323 Crescent St SE
- 2043 Blake Blvd SE
- 318 Crescent St SE
- 334 Crescent St SE
- 2034 Blake Blvd SE
- 2119 Blake Blvd SE
- 335 Crescent St SE
- 2035 Blake Blvd SE
- 314 Crescent St SE
- 2127 Blake Blvd SE
- 2130 Blake Blvd SE
- 336 Crescent St SE
- 2022 Blake Blvd SE
- 2029 Blake Blvd SE
- 2135 Blake Blvd SE