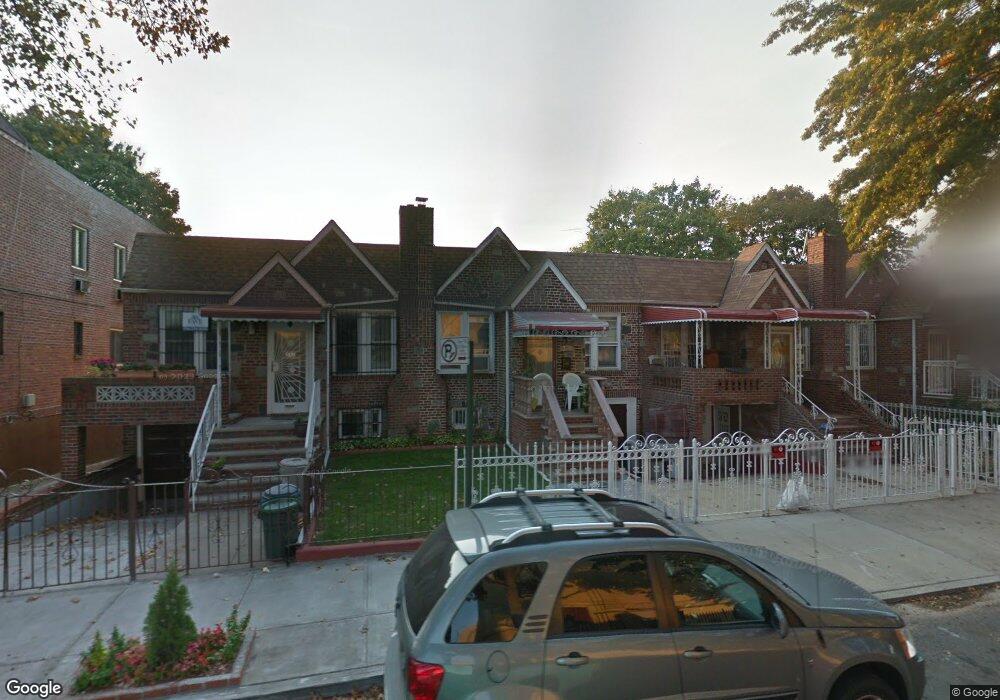
328 E 57th St Brooklyn, NY 11203
East Flatbush NeighborhoodEstimated Value: $698,000 - $778,000
Studio
--
Bath
1,848
Sq Ft
$401/Sq Ft
Est. Value
About This Home
This home is located at 328 E 57th St, Brooklyn, NY 11203 and is currently estimated at $741,735, approximately $401 per square foot. 328 E 57th St is a home located in Kings County with nearby schools including Ps 244 Richard R Green, I.S. 285 Meyer Levin, and Ivy Hill Preparatory Charter School.
Ownership History
Date
Name
Owned For
Owner Type
Purchase Details
Closed on
Feb 20, 2014
Sold by
Adams Monley and Adams Yeon
Bought by
Adams Monley
Current Estimated Value
Home Financials for this Owner
Home Financials are based on the most recent Mortgage that was taken out on this home.
Original Mortgage
$401,302
Outstanding Balance
$301,242
Interest Rate
4.32%
Mortgage Type
New Conventional
Estimated Equity
$440,493
Purchase Details
Closed on
Apr 13, 2006
Sold by
Adams Monley
Bought by
Adams Monley and Adams Yeon
Purchase Details
Closed on
Jun 18, 2001
Sold by
Adams Monley
Bought by
Adams Monley
Home Financials for this Owner
Home Financials are based on the most recent Mortgage that was taken out on this home.
Original Mortgage
$202,850
Interest Rate
7.18%
Purchase Details
Closed on
Feb 23, 2000
Sold by
Thomas Eloina
Bought by
Adams Monley and Gordon Garvin G
Home Financials for this Owner
Home Financials are based on the most recent Mortgage that was taken out on this home.
Original Mortgage
$182,590
Interest Rate
8.4%
Mortgage Type
FHA
Create a Home Valuation Report for This Property
The Home Valuation Report is an in-depth analysis detailing your home's value as well as a comparison with similar homes in the area
Home Values in the Area
Average Home Value in this Area
Purchase History
| Date | Buyer | Sale Price | Title Company |
|---|---|---|---|
| Adams Monley | -- | -- | |
| Adams Monley | -- | -- | |
| Adams Monley | -- | -- | |
| Adams Monley | -- | -- | |
| Adams Monley | -- | -- | |
| Adams Monley | -- | -- | |
| Adams Monley | -- | -- | |
| Adams Monley | -- | -- |
Source: Public Records
Mortgage History
| Date | Status | Borrower | Loan Amount |
|---|---|---|---|
| Open | Adams Monley | $401,302 | |
| Closed | Adams Monley | $401,302 | |
| Previous Owner | Adams Monley | $202,850 | |
| Previous Owner | Adams Monley | $182,590 | |
| Closed | Adams Monley | $0 |
Source: Public Records
Tax History
| Year | Tax Paid | Tax Assessment Tax Assessment Total Assessment is a certain percentage of the fair market value that is determined by local assessors to be the total taxable value of land and additions on the property. | Land | Improvement |
|---|---|---|---|---|
| 2025 | $5,836 | $47,880 | $14,400 | $33,480 |
| 2024 | $5,836 | $37,800 | $14,400 | $23,400 |
| 2023 | $4,893 | $40,380 | $14,400 | $25,980 |
| 2022 | $4,738 | $42,420 | $14,400 | $28,020 |
| 2021 | $5,705 | $36,900 | $14,400 | $22,500 |
| 2020 | $2,666 | $32,040 | $14,400 | $17,640 |
| 2019 | $5,016 | $33,480 | $14,400 | $19,080 |
| 2018 | $4,876 | $25,380 | $10,877 | $14,503 |
| 2017 | $4,834 | $25,186 | $12,361 | $12,825 |
| 2016 | $4,440 | $23,761 | $12,424 | $11,337 |
| 2015 | $2,646 | $22,417 | $12,418 | $9,999 |
| 2014 | $2,646 | $21,150 | $12,118 | $9,032 |
Source: Public Records
Map
Nearby Homes
- 326 E 57th St
- 332 E 57th St
- 324 E 57th St
- 334 E 57th St
- 338 E 57th St
- 338 E 57th St Unit 1
- 318 E 57th St
- 318 E 57th St Unit House
- 340 E 57th St
- 375 E 56th St Unit 1B
- 375 E 56th St
- 371 E 56th St
- 316 E 57th St
- 316 E 57th St Unit SIX
- 316 E 57th St Unit 1
- 316 E 57th St Unit 12
- 316 E 57th St Unit 6
- 316 E 57th St Unit 1A
- 316 E 57th St Unit 17
- 377 E 56th St
Your Personal Tour Guide
Ask me questions while you tour the home.