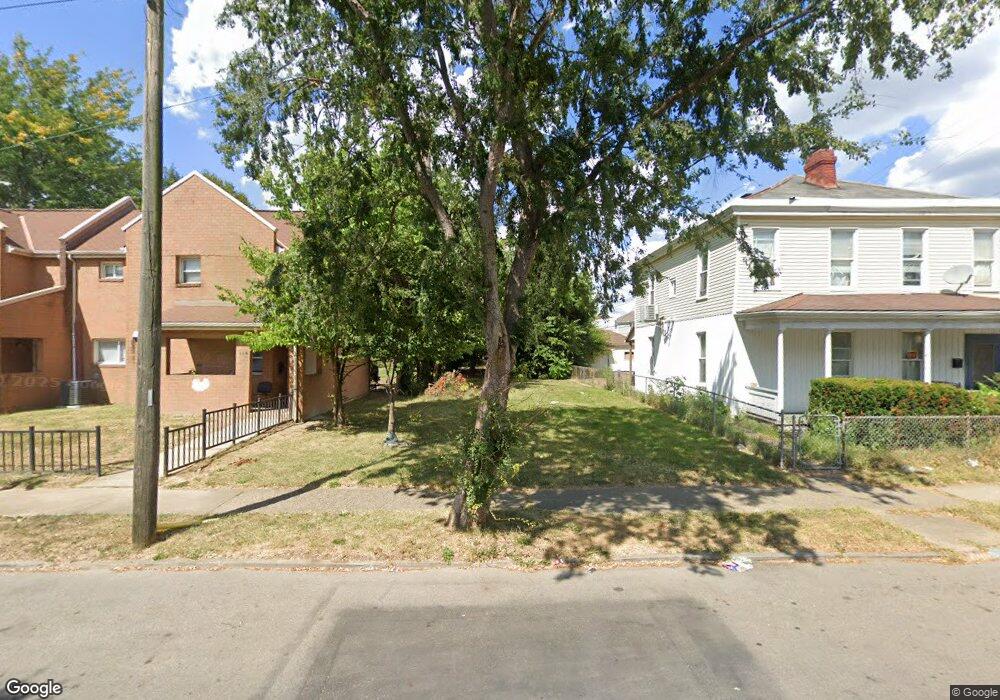
328 E Barthman Ave Columbus, OH 43207
Reeb-Hosack/Hungarian Village NeighborhoodEstimated Value: $37,000
3
Beds
2
Baths
1,722
Sq Ft
$21/Sq Ft
Est. Value
About This Home
This home is located at 328 E Barthman Ave, Columbus, OH 43207 and is currently priced at $37,000, approximately $21 per square foot. 328 E Barthman Ave is a home located in Franklin County with nearby schools including Southwood Elementary School, South High School, and Saint Mary School German Village.
Ownership History
Date
Name
Owned For
Owner Type
Purchase Details
Closed on
May 30, 2017
Sold by
Winchester Financial Llc
Bought by
Central Ohio Community Improvemnet Corpo
Current Estimated Value
Purchase Details
Closed on
May 8, 2007
Sold by
Jp Morgan Chase Bank
Bought by
Blake James W and Blake Cynthia D
Home Financials for this Owner
Home Financials are based on the most recent Mortgage that was taken out on this home.
Original Mortgage
$63,800
Interest Rate
6.27%
Mortgage Type
Commercial
Purchase Details
Closed on
Nov 9, 2006
Sold by
Logan Clyde H and Logan Clyde
Bought by
Jpmorgan Chase Bank and Equity One Abs Inc Mortgage Pass Through
Purchase Details
Closed on
Jan 11, 1997
Sold by
Estate Of Ruth M Logan
Bought by
Logan Clyde H
Create a Home Valuation Report for This Property
The Home Valuation Report is an in-depth analysis detailing your home's value as well as a comparison with similar homes in the area
Home Values in the Area
Average Home Value in this Area
Purchase History
| Date | Buyer | Sale Price | Title Company |
|---|---|---|---|
| Central Ohio Community Improvemnet Corpo | -- | None Available | |
| Blake James W | $30,000 | Accutitle Agency Inc | |
| Jpmorgan Chase Bank | $40,000 | None Available | |
| Logan Clyde H | -- | -- |
Source: Public Records
Mortgage History
| Date | Status | Borrower | Loan Amount |
|---|---|---|---|
| Previous Owner | Blake James W | $63,800 |
Source: Public Records
Tax History
| Year | Tax Paid | Tax Assessment Tax Assessment Total Assessment is a certain percentage of the fair market value that is determined by local assessors to be the total taxable value of land and additions on the property. | Land | Improvement |
|---|---|---|---|---|
| 2025 | -- | $5,220 | $5,220 | -- |
| 2024 | -- | $5,220 | $5,220 | -- |
| 2023 | $0 | $5,215 | $5,215 | $0 |
| 2022 | $0 | $4,520 | $4,520 | $0 |
| 2021 | $0 | $4,520 | $4,520 | $0 |
| 2020 | $0 | $4,520 | $4,520 | $0 |
| 2019 | $3,902 | $4,100 | $4,100 | $0 |
| 2018 | $1,067 | $4,100 | $4,100 | $0 |
| 2017 | $3,635 | $16,840 | $4,100 | $12,740 |
| 2016 | $4,332 | $13,970 | $3,400 | $10,570 |
| 2015 | $2,020 | $13,970 | $3,400 | $10,570 |
| 2014 | $866 | $13,970 | $3,400 | $10,570 |
| 2013 | $663 | $14,700 | $3,570 | $11,130 |
Source: Public Records
Map
Nearby Homes
- 292 E Barthman Ave
- 238 E Barthman Ave
- 259 Hinkle Ave
- 1808 S 6th St Unit 810
- 160 E Barthman Ave
- 1756 Bruck St
- 1858 S 5th St Unit 860
- 457 E Woodrow Ave Unit 459
- 332 E Hinman Ave
- 172 E Woodrow Ave
- 379 E Morrill Ave
- 177 E Hinman Ave
- 92 E Innis Ave
- 1696 Parsons Ave
- 1692 Parsons Ave
- 130 E Woodrow Ave
- 149 E Hinman Ave
- 464 E Hinman Ave
- 472 E Hinman Ave
- 1624 S 8th St
- 326 E Barthman Ave Unit 328
- 330 E Barthman Ave Unit 332
- 317 E Barthman Ave Unit 319
- 1896 S Washington Ave Unit DRY
- 323-325 E Barthman Ave
- 308 E Barthman Ave
- 1890 S Washington Ave Unit DRY
- 0 E Barthman Ave
- 323 E Barthman Ave Unit 325
- 341 E Barthman Ave
- 333 E Barthman Ave
- 1884 S Washington Ave Unit DRY
- 1885 S Washington Ave Unit 887
- 337 E Barthman Ave
- 313 E Barthman Ave Unit 315
- 1878 S Washington Ave Unit DRY
- 1886 S Washington Ave
- 329 Reeb Ave Unit 331
- 327 Reeb Ave
- 1872 S Washington Ave Unit DRY
Your Personal Tour Guide
Ask me questions while you tour the home.