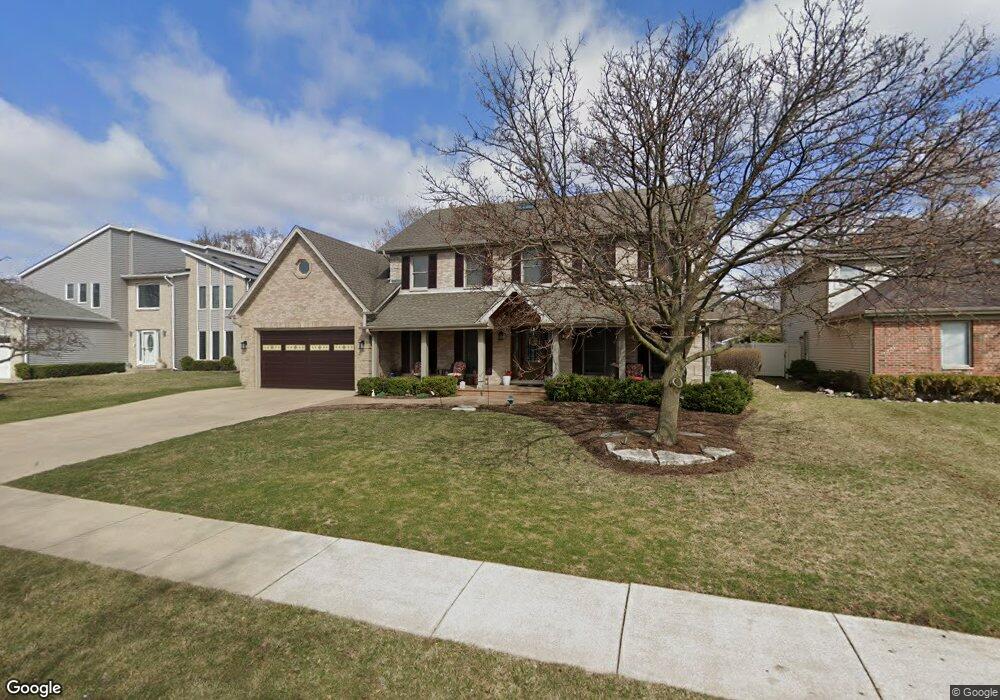
328 E Mckenna Ct Elmhurst, IL 60126
Estimated Value: $958,000 - $1,085,000
Studio
--
Bath
3,230
Sq Ft
$315/Sq Ft
Est. Value
About This Home
This home is located at 328 E Mckenna Ct, Elmhurst, IL 60126 and is currently estimated at $1,017,656, approximately $315 per square foot. 328 E Mckenna Ct is a home located in DuPage County with nearby schools including Jackson Elementary School, Bryan Middle School, and York Community High School.
Ownership History
Date
Name
Owned For
Owner Type
Purchase Details
Closed on
Feb 2, 2012
Sold by
Stratton Steven and Stratton Linda M
Bought by
Declara Stratton Steven G and Steven G Stratton 2012 Declaration Of Tr
Current Estimated Value
Purchase Details
Closed on
Apr 2, 2002
Sold by
Stratton Steven
Bought by
Stratton Steven and Stratton Linda M
Home Financials for this Owner
Home Financials are based on the most recent Mortgage that was taken out on this home.
Original Mortgage
$242,920
Interest Rate
5.46%
Mortgage Type
Stand Alone Refi Refinance Of Original Loan
Purchase Details
Closed on
Jun 1, 1995
Sold by
Stratton Stephen G and Stratton Sharon L
Bought by
Stratton Steven G
Home Financials for this Owner
Home Financials are based on the most recent Mortgage that was taken out on this home.
Original Mortgage
$60,000
Interest Rate
7.81%
Create a Home Valuation Report for This Property
The Home Valuation Report is an in-depth analysis detailing your home's value as well as a comparison with similar homes in the area
Home Values in the Area
Average Home Value in this Area
Purchase History
| Date | Buyer | Sale Price | Title Company |
|---|---|---|---|
| Declara Stratton Steven G | -- | None Available | |
| Stratton Steven | -- | Commercial Land Title | |
| Stratton Steven G | -- | -- |
Source: Public Records
Mortgage History
| Date | Status | Borrower | Loan Amount |
|---|---|---|---|
| Closed | Stratton Steven | $242,920 | |
| Closed | Stratton Steven G | $60,000 |
Source: Public Records
Tax History
| Year | Tax Paid | Tax Assessment Tax Assessment Total Assessment is a certain percentage of the fair market value that is determined by local assessors to be the total taxable value of land and additions on the property. | Land | Improvement |
|---|---|---|---|---|
| 2024 | $14,321 | $275,422 | $55,887 | $219,535 |
| 2023 | $13,677 | $254,690 | $51,680 | $203,010 |
| 2022 | $13,156 | $244,840 | $49,690 | $195,150 |
| 2021 | $12,776 | $238,750 | $48,450 | $190,300 |
| 2020 | $12,182 | $233,520 | $47,390 | $186,130 |
| 2019 | $11,558 | $222,020 | $45,060 | $176,960 |
| 2018 | $10,733 | $204,750 | $42,660 | $162,090 |
| 2017 | $10,462 | $195,110 | $40,650 | $154,460 |
| 2016 | $10,243 | $183,800 | $38,290 | $145,510 |
| 2015 | $9,998 | $171,230 | $35,670 | $135,560 |
| 2014 | $8,823 | $141,660 | $38,390 | $103,270 |
| 2013 | $8,621 | $143,660 | $38,930 | $104,730 |
Source: Public Records
Map
Nearby Homes
- 15W320 Concord St
- 323 E Butterfield Rd
- 353 E Butterfield Rd
- 918 S Cambridge Ave
- 110 W Butterfield Rd Unit 502S
- 956 S Cadwell Ave
- 806 Wildwood Ct
- 837 S Kearsage Ave
- 1200 S Prospect Ave Unit 108
- 142 E Quincy St
- 857 S Euclid Ave
- 522 E Park Manor Ct
- 101 W Jackson St
- 788 S Cambridge Ave
- 2 S Atrium Way Unit 203
- 130 Crab Apple Ln
- 878 S Parkside Ave
- 601-1 Harger Rd
- 936 S Mitchell Ave
- 2050 Atwood Ave
- 324 E Mckenna Ct
- 15W330 E Mc Kenna Ct
- 338 E Mckenna Ct
- 334 E Mckenna Ct
- 320 E Mckenna Ct
- 323 E Mckenna Ct
- 15W338 E Mckenna Ct
- 15W330 E Mckenna Ct
- 15W393 Fillmore St
- 15W365 Fillmore St
- 15W411 Fillmore St
- 329 E Mckenna Ct
- 0S761 Old York Rd Unit 20B
- 0S761 Old York Rd Unit 20
- 0S761 Old York Rd Unit 16B
- 0S761 Old York Rd
- 0S761 Old York Rd Unit 12A
- 0S761 Old York Rd Unit 17A
- 15W355 Fillmore St
- 0S681 Old York Rd
Your Personal Tour Guide
Ask me questions while you tour the home.