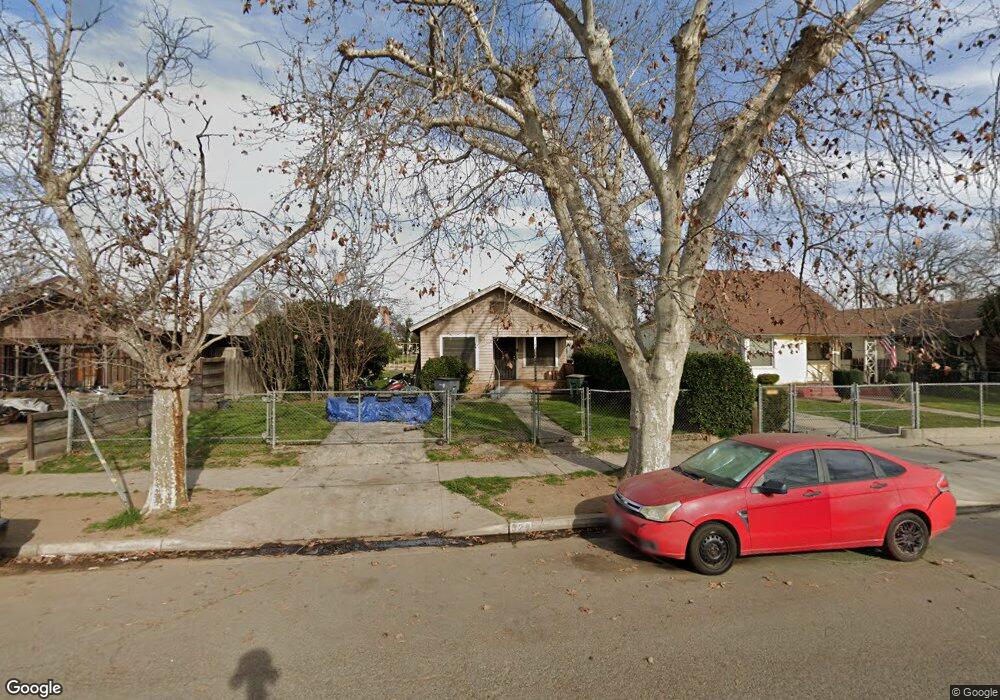
328 E St Fresno, CA 93706
Downtown Fresno NeighborhoodEstimated Value: $260,525 - $282,000
2
Beds
1
Bath
864
Sq Ft
$319/Sq Ft
Est. Value
About This Home
This home is located at 328 E St, Fresno, CA 93706 and is currently estimated at $275,631, approximately $319 per square foot. 328 E St is a home located in Fresno County with nearby schools including Lincoln Elementary School, Rutherford B. Gaston Sr. Middle, and Edison High School.
Ownership History
Date
Name
Owned For
Owner Type
Purchase Details
Closed on
Dec 15, 2022
Sold by
Stell Sean
Bought by
Stell Sean M
Current Estimated Value
Home Financials for this Owner
Home Financials are based on the most recent Mortgage that was taken out on this home.
Original Mortgage
$60,000
Outstanding Balance
$58,242
Interest Rate
7.08%
Mortgage Type
New Conventional
Estimated Equity
$217,389
Purchase Details
Closed on
Aug 12, 2022
Sold by
Erving Zeno Sr
Bought by
Stell Sean
Purchase Details
Closed on
Mar 24, 2010
Sold by
Yeverino Frances
Bought by
Zeno Erving
Purchase Details
Closed on
Nov 9, 2007
Sold by
Baquera Delorse and Linder Delorse L
Bought by
Baquera Theresa L
Purchase Details
Closed on
Oct 31, 2007
Sold by
Bacio Valentino
Bought by
Yeverino Frances
Purchase Details
Closed on
Aug 27, 2001
Sold by
Bacio Jessie
Bought by
Bacio Valentino
Create a Home Valuation Report for This Property
The Home Valuation Report is an in-depth analysis detailing your home's value as well as a comparison with similar homes in the area
Home Values in the Area
Average Home Value in this Area
Purchase History
| Date | Buyer | Sale Price | Title Company |
|---|---|---|---|
| Stell Sean M | -- | Erecording Partners Network | |
| Zeno Erving | -- | Erecording Partners Network | |
| Stell Sean | -- | None Listed On Document | |
| Zeno Erving | $33,000 | Fidelity National Title Co | |
| Baquera Theresa L | -- | None Available | |
| Yeverino Frances | -- | None Available | |
| Bacio Valentino | -- | -- |
Source: Public Records
Mortgage History
| Date | Status | Borrower | Loan Amount |
|---|---|---|---|
| Open | Stell Sean M | $60,000 |
Source: Public Records
Tax History Compared to Growth
Tax History
| Year | Tax Paid | Tax Assessment Tax Assessment Total Assessment is a certain percentage of the fair market value that is determined by local assessors to be the total taxable value of land and additions on the property. | Land | Improvement |
|---|---|---|---|---|
| 2025 | $2,329 | $192,474 | $46,818 | $145,656 |
| 2024 | $2,329 | $188,700 | $45,900 | $142,800 |
| 2023 | $2,283 | $185,000 | $45,000 | $140,000 |
| 2022 | $539 | $40,132 | $12,160 | $27,972 |
| 2021 | $524 | $39,346 | $11,922 | $27,424 |
| 2020 | $522 | $38,943 | $11,800 | $27,143 |
| 2019 | $503 | $38,180 | $11,569 | $26,611 |
| 2018 | $492 | $37,433 | $11,343 | $26,090 |
| 2017 | $484 | $36,700 | $11,121 | $25,579 |
| 2016 | $469 | $35,981 | $10,903 | $25,078 |
| 2015 | $462 | $35,442 | $10,740 | $24,702 |
| 2014 | $451 | $34,749 | $10,530 | $24,219 |
Source: Public Records
Map
Nearby Homes