Estimated Value: $92,000 - $137,000
3
Beds
2
Baths
1,952
Sq Ft
$62/Sq Ft
Est. Value
About This Home
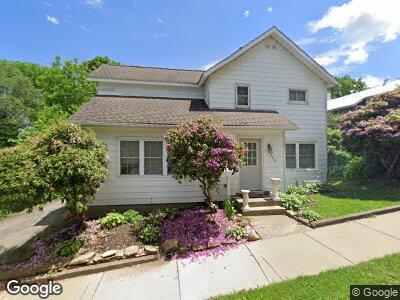
This home is located at 328 Euclid St, Corry, PA 16407 and is currently estimated at $120,248, approximately $61 per square foot. 328 Euclid St is a home located in Erie County with nearby schools including Corry Area Primary School, Corry Area Intermediate School, and Corry Area Middle School.
Ownership History
Date
Name
Owned For
Owner Type
Purchase Details
Closed on
May 19, 2025
Sold by
Hogan Family Trust and Stromenger Michael
Bought by
Witherite Annabell
Current Estimated Value
Purchase Details
Closed on
May 20, 2022
Sold by
Diane Hogan
Bought by
Hogan Family Trust
Purchase Details
Closed on
Mar 28, 2012
Sold by
Carlson Holly A
Bought by
Hogan Diane
Home Financials for this Owner
Home Financials are based on the most recent Mortgage that was taken out on this home.
Original Mortgage
$67,932
Interest Rate
3.67%
Mortgage Type
FHA
Purchase Details
Closed on
Aug 15, 2009
Sold by
Carlson Thomas A and Carlson Holly A
Bought by
Carlson Holly A
Home Financials for this Owner
Home Financials are based on the most recent Mortgage that was taken out on this home.
Original Mortgage
$59,676
Interest Rate
5.09%
Mortgage Type
FHA
Create a Home Valuation Report for This Property
The Home Valuation Report is an in-depth analysis detailing your home's value as well as a comparison with similar homes in the area
Home Values in the Area
Average Home Value in this Area
Purchase History
| Date | Buyer | Sale Price | Title Company |
|---|---|---|---|
| Witherite Annabell | $73,500 | None Listed On Document | |
| Hogan Family Trust | $58,100 | None Listed On Document | |
| Hogan Diane | $70,700 | Associates Title Inc | |
| Carlson Holly A | -- | None Available |
Source: Public Records
Mortgage History
| Date | Status | Borrower | Loan Amount |
|---|---|---|---|
| Previous Owner | Hogan Diane | $67,932 | |
| Previous Owner | Carlson Holly A | $59,676 |
Source: Public Records
Tax History Compared to Growth
Tax History
| Year | Tax Paid | Tax Assessment Tax Assessment Total Assessment is a certain percentage of the fair market value that is determined by local assessors to be the total taxable value of land and additions on the property. | Land | Improvement |
|---|---|---|---|---|
| 2025 | $1,754 | $53,620 | $4,900 | $48,720 |
| 2024 | $1,742 | $53,620 | $4,900 | $48,720 |
| 2023 | $1,699 | $53,620 | $4,900 | $48,720 |
| 2022 | $1,667 | $53,620 | $4,900 | $48,720 |
| 2021 | $1,655 | $53,620 | $4,900 | $48,720 |
| 2020 | $1,642 | $53,620 | $4,900 | $48,720 |
| 2019 | $1,616 | $53,620 | $4,900 | $48,720 |
| 2018 | $1,594 | $53,620 | $4,900 | $48,720 |
| 2017 | $1,567 | $53,620 | $4,900 | $48,720 |
| 2016 | $1,690 | $53,620 | $4,900 | $48,720 |
| 2015 | $1,676 | $53,620 | $4,900 | $48,720 |
| 2014 | $725 | $53,620 | $4,900 | $48,720 |
Source: Public Records
Map
Nearby Homes