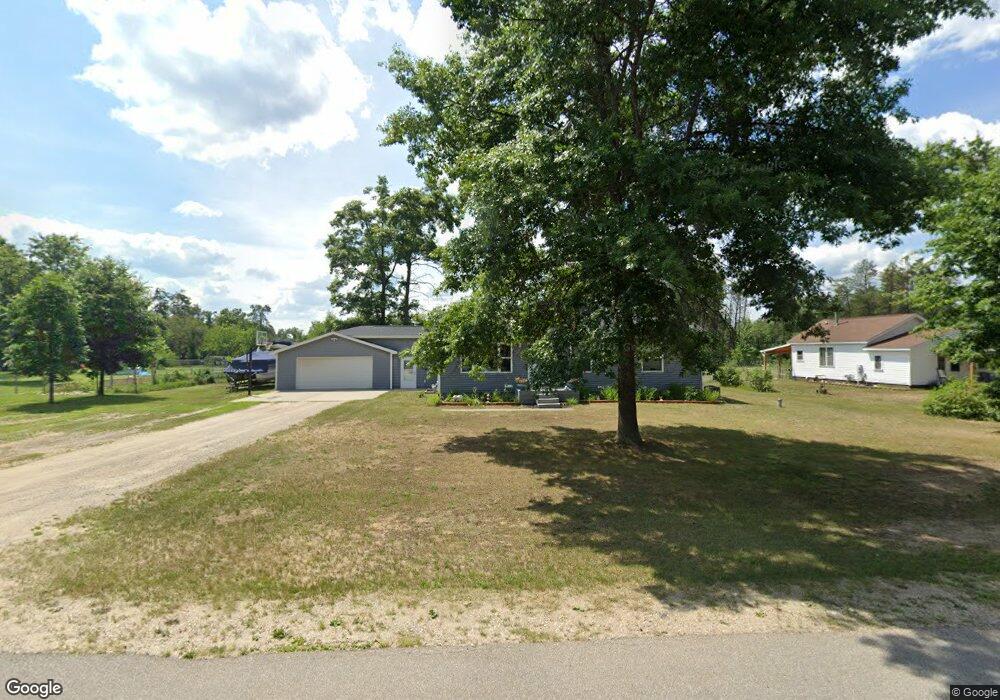
328 Red Tailed Hawk Loop Grayling, MI 49738
Estimated Value: $176,972 - $296,000
3
Beds
2
Baths
2,016
Sq Ft
$123/Sq Ft
Est. Value
About This Home
This home is located at 328 Red Tailed Hawk Loop, Grayling, MI 49738 and is currently estimated at $246,993, approximately $122 per square foot. 328 Red Tailed Hawk Loop is a home located in Crawford County with nearby schools including Grayling Elementary School, Grayling Middle School, and Grayling High School.
Ownership History
Date
Name
Owned For
Owner Type
Purchase Details
Closed on
Oct 24, 2008
Sold by
Lasich Bernard J
Bought by
Addington Steven and Addington Nichole
Current Estimated Value
Purchase Details
Closed on
Feb 16, 2007
Sold by
Lasich Bernard
Bought by
Addington Steven J
Purchase Details
Closed on
Aug 1, 2006
Bought by
Lasich Bernard
Purchase Details
Closed on
Jul 31, 2006
Bought by
Lasich Bernard
Purchase Details
Closed on
Nov 23, 2005
Sold by
Elford Edward W and Elford Sonya K
Bought by
Chase Home Finance Llc
Purchase Details
Closed on
Jun 6, 2005
Sold by
Elford Edward
Bought by
Elford Edward W and Elford Sonya K
Purchase Details
Closed on
Apr 26, 2002
Bought by
Elford Edward
Purchase Details
Closed on
May 30, 2001
Sold by
Stephenson Mark and Stephenson Kathryn
Bought by
Elliot, Judith Living Trust
Purchase Details
Closed on
Nov 4, 1987
Sold by
Lerg Paul
Bought by
Stephenson Mark and Stephenson Kathryn
Create a Home Valuation Report for This Property
The Home Valuation Report is an in-depth analysis detailing your home's value as well as a comparison with similar homes in the area
Home Values in the Area
Average Home Value in this Area
Purchase History
| Date | Buyer | Sale Price | Title Company |
|---|---|---|---|
| Addington Steven | $79,000 | -- | |
| Addington Steven J | $79,000 | -- | |
| Lasich Bernard | $48,000 | -- | |
| Lasich Bernard | $48,000 | -- | |
| Chase Home Finance Llc | $64,600 | -- | |
| Elford Edward W | -- | -- | |
| Elford Edward | $67,000 | -- | |
| Elliot, Judith Living Trust | $30,200 | -- | |
| Stephenson Mark | $3,800 | -- |
Source: Public Records
Tax History
| Year | Tax Paid | Tax Assessment Tax Assessment Total Assessment is a certain percentage of the fair market value that is determined by local assessors to be the total taxable value of land and additions on the property. | Land | Improvement |
|---|---|---|---|---|
| 2025 | $1,058 | $98,700 | $2,300 | $96,400 |
| 2024 | $1,034 | $91,700 | $2,300 | $89,400 |
| 2023 | $989 | $80,600 | $2,300 | $78,300 |
| 2022 | $942 | $72,400 | $2,300 | $70,100 |
| 2021 | $1,599 | $65,300 | $2,300 | $63,000 |
| 2020 | $1,581 | $64,500 | $2,300 | $62,200 |
| 2019 | $846 | $40,800 | $2,300 | $38,500 |
| 2018 | $833 | $35,800 | $2,300 | $33,500 |
| 2017 | $551 | $33,400 | $2,300 | $31,100 |
| 2016 | $546 | $30,200 | $30,200 | $0 |
| 2015 | $796 | $30,200 | $0 | $0 |
| 2014 | -- | $29,600 | $0 | $0 |
| 2013 | -- | $29,200 | $0 | $0 |
Source: Public Records
Map
Nearby Homes
- 4079 W Pinecrest Rd
- 4900 Helen Dr
- 3169 W Jones Lake Rd
- 3002 W Jones Lake Rd
- 4593 Orbit Dr
- 1205 E Michigan Ave
- 3028 Palmer Place
- Lot 4 Erie St
- Lot 82 Evelyn Ave
- 0 Palmer Place Unit 20261018722
- 0 Palmer Place Unit 20261018714
- 704 Elm St
- 205 Park St
- 1024 S I-75 Business Loop
- 809 Maple St
- 109 Madsen St
- 2706 Newatch Ave
- 110 State St
- 300 Rolla St
- 2698 Newatch Ave
- 326 Red Tailed Hawk Loop
- 330 Red Tailed Hawk Loop
- 352 Red Tailed Hawk Loop
- 324 Red Tailed Hawk Loop
- 338 Red Tailed Hawk Loop
- 350 Red Tailed Hawk Loop
- 354 Red Tailed Hawk Loop
- 327 Red Tailed Hawk Loop
- 325 Red Tailed Hawk Loop
- 329 Red Tailed Hawk Loop
- 348 Red Tailed Hawk Loop
- 350 Red Tailed Hawk Lp
- 356 Red Tailed Hawk Loop
- 314 Red Tailed Hawk Loop
- 323 Red Tailed Hawk Loop
- 0 Red Tailed Hawk Loop
- 331 Red Tailed Hawk Loop
- 0 Wendy Ln Unit 274213
- 0 Wendy Ln Unit Parcels 6B, 6C and 6
- 310 Red Tailed Hawk Loop
Your Personal Tour Guide
Ask me questions while you tour the home.