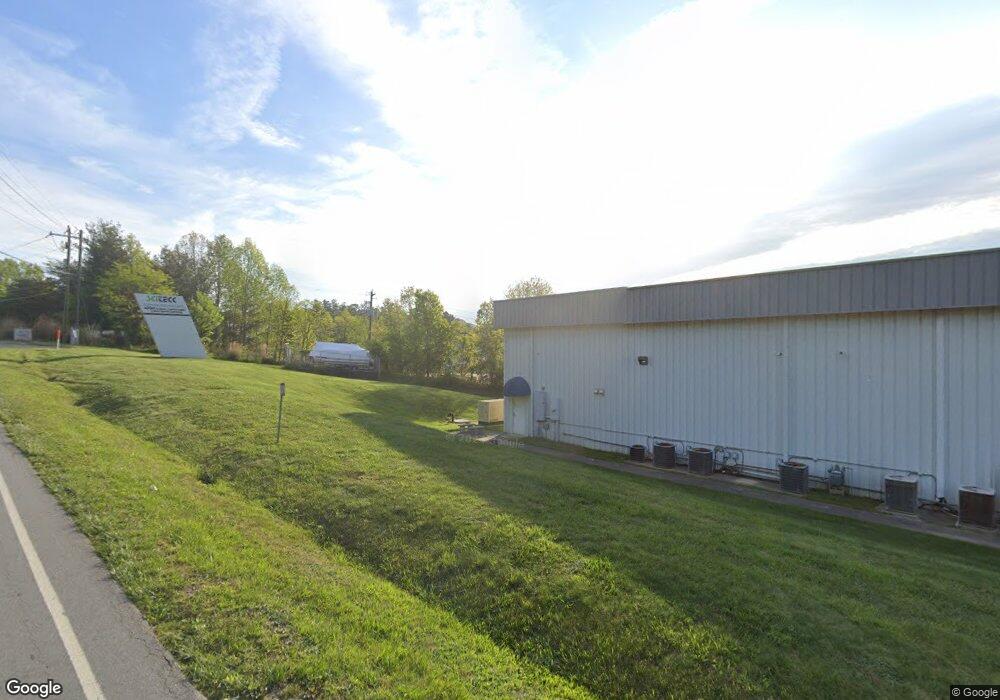
328 Rutledge Rd Fletcher, NC 28732
Oak Park NeighborhoodEstimated Value: $4,178,996
--
Bed
--
Bath
34,456
Sq Ft
$121/Sq Ft
Est. Value
About This Home
This home is located at 328 Rutledge Rd, Fletcher, NC 28732 and is currently estimated at $4,178,996, approximately $121 per square foot. 328 Rutledge Rd is a home located in Buncombe County with nearby schools including T.C. Roberson High School, Avery's Creek Elementary School, and Koontz Intermediate School.
Ownership History
Date
Name
Owned For
Owner Type
Purchase Details
Closed on
May 19, 2016
Sold by
Cj Mars Rutledge Llc
Bought by
Rutledge Rd Llc
Current Estimated Value
Purchase Details
Closed on
Feb 5, 2014
Sold by
Robertson Rutledge Investments Llc
Bought by
Cj Mars Rutledge Llc
Home Financials for this Owner
Home Financials are based on the most recent Mortgage that was taken out on this home.
Original Mortgage
$1,240,000
Interest Rate
4.51%
Mortgage Type
Future Advance Clause Open End Mortgage
Purchase Details
Closed on
Mar 6, 2012
Sold by
Jackson Robertson Investors Llc
Bought by
Robertson Rutledge Investmens
Home Financials for this Owner
Home Financials are based on the most recent Mortgage that was taken out on this home.
Original Mortgage
$800,000
Interest Rate
3.89%
Mortgage Type
Commercial
Purchase Details
Closed on
Oct 29, 1999
Sold by
Matthews Edwin Keith and Estate Of Edwin Keith Matthews
Bought by
Jackson/Robertson Investors Llc
Create a Home Valuation Report for This Property
The Home Valuation Report is an in-depth analysis detailing your home's value as well as a comparison with similar homes in the area
Home Values in the Area
Average Home Value in this Area
Purchase History
| Date | Buyer | Sale Price | Title Company |
|---|---|---|---|
| Rutledge Rd Llc | $1,950,000 | None Available | |
| Cj Mars Rutledge Llc | $1,550,000 | None Available | |
| Robertson Rutledge Investmens | $1,155,500 | None Available | |
| Jackson/Robertson Investors Llc | $790,000 | -- |
Source: Public Records
Mortgage History
| Date | Status | Borrower | Loan Amount |
|---|---|---|---|
| Previous Owner | Cj Mars Rutledge Llc | $1,240,000 | |
| Previous Owner | Robertson Rutledge Investmens | $800,000 |
Source: Public Records
Tax History Compared to Growth
Tax History
| Year | Tax Paid | Tax Assessment Tax Assessment Total Assessment is a certain percentage of the fair market value that is determined by local assessors to be the total taxable value of land and additions on the property. | Land | Improvement |
|---|---|---|---|---|
| 2025 | $12,556 | $2,039,700 | $1,023,000 | $1,016,700 |
| 2024 | $12,556 | $2,039,700 | $1,023,000 | $1,016,700 |
| 2023 | $12,556 | $2,039,700 | $1,023,000 | $1,016,700 |
| 2022 | $11,953 | $2,039,700 | $0 | $0 |
| 2021 | $11,953 | $2,039,700 | $0 | $0 |
| 2020 | $11,870 | $1,884,200 | $0 | $0 |
| 2019 | $11,870 | $1,884,200 | $0 | $0 |
| 2018 | $11,870 | $1,884,200 | $0 | $0 |
| 2017 | $0 | $1,289,300 | $0 | $0 |
| 2016 | $8,961 | $1,289,300 | $0 | $0 |
| 2015 | $8,961 | $1,289,300 | $0 | $0 |
| 2014 | $8,961 | $1,289,300 | $0 | $0 |
Source: Public Records
Map
Nearby Homes
- 550 Airport Rd
- 3 E Wilde Way
- 412 Wiltshire Cir
- 48 Lanceford Cir
- 24 Lanceford Cir
- 36 Twain Trail
- 93 Stafford Ct
- 85 Twain Trail
- 324 Wiltshire Cir
- 57 Founders Way
- Barrington Plan at The Authors
- Winston Plan at The Authors
- Palmer Plan at The Authors
- Madison Plan at The Authors
- Pelham Plan at The Authors
- Carlisle Plan at The Authors
- Kingsley Plan at The Authors
- Canterbury Plan at The Authors
- Oxford Plan at The Authors
- Hampton Plan at The Authors
- 233 Airport Rd
- 318 Rutledge Rd
- 0000 Spruce Dr
- 15 Design Ave Unit 208
- 550 Airport Rd Unit Lot 1
- 550 Airport Rd Unit Lot 4
- 550 Airport Rd Unit Lot 3
- 550 Airport Rd Unit Lot 2
- 303 New Airport Rd
- 229 Airport Rd
- 317 Rutledge Rd
- 300 Airport Rd Unit 30B
- 225 Airport Rd
- 225 Airport Rd
- 341 Airport Rd Unit 300
- 15 Old Lime Kiln Rd
- 21 Old Lime Kiln Rd
- 270 Rutledge Rd
- 314 Airport Rd
- 221 Airport Rd