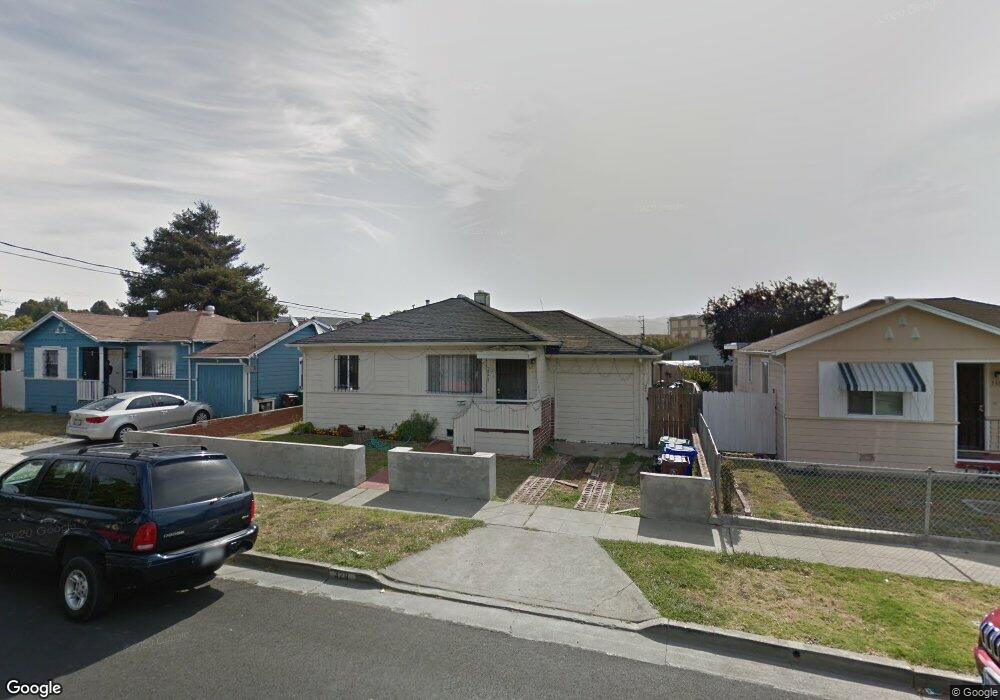
328 S 28th St Richmond, CA 94804
Cortez-Stege NeighborhoodEstimated Value: $300,000 - $449,000
2
Beds
1
Bath
728
Sq Ft
$543/Sq Ft
Est. Value
About This Home
This home is located at 328 S 28th St, Richmond, CA 94804 and is currently estimated at $395,080, approximately $542 per square foot. 328 S 28th St is a home located in Contra Costa County with nearby schools including Coronado Elementary School, Lovonya DeJean Middle School, and John F. Kennedy High School.
Ownership History
Date
Name
Owned For
Owner Type
Purchase Details
Closed on
Aug 25, 2009
Sold by
Citibank Na
Bought by
Seelam Venkata Ravi
Current Estimated Value
Purchase Details
Closed on
Jul 31, 2009
Sold by
Tadeo Felix and Tadeo Elsy
Bought by
Citibank Na
Purchase Details
Closed on
Aug 24, 2006
Sold by
Knox Jimmie
Bought by
Tadeo Felix and Tadeo Elsy
Home Financials for this Owner
Home Financials are based on the most recent Mortgage that was taken out on this home.
Original Mortgage
$240,000
Interest Rate
7.75%
Mortgage Type
Purchase Money Mortgage
Create a Home Valuation Report for This Property
The Home Valuation Report is an in-depth analysis detailing your home's value as well as a comparison with similar homes in the area
Home Values in the Area
Average Home Value in this Area
Purchase History
| Date | Buyer | Sale Price | Title Company |
|---|---|---|---|
| Seelam Venkata Ravi | $59,000 | Fidelity National Title | |
| Citibank Na | $268,031 | None Available | |
| Tadeo Felix | $300,000 | Chicago Title Co |
Source: Public Records
Mortgage History
| Date | Status | Borrower | Loan Amount |
|---|---|---|---|
| Previous Owner | Tadeo Felix | $240,000 |
Source: Public Records
Tax History Compared to Growth
Tax History
| Year | Tax Paid | Tax Assessment Tax Assessment Total Assessment is a certain percentage of the fair market value that is determined by local assessors to be the total taxable value of land and additions on the property. | Land | Improvement |
|---|---|---|---|---|
| 2025 | $2,527 | $76,142 | $12,901 | $63,241 |
| 2024 | $2,507 | $74,650 | $12,649 | $62,001 |
| 2023 | $2,507 | $73,187 | $12,401 | $60,786 |
| 2022 | $2,423 | $71,753 | $12,158 | $59,595 |
| 2021 | $2,353 | $70,347 | $11,920 | $58,427 |
| 2019 | $2,195 | $68,262 | $11,567 | $56,695 |
| 2018 | $2,107 | $66,925 | $11,341 | $55,584 |
| 2017 | $2,038 | $65,614 | $11,119 | $54,495 |
| 2016 | $1,973 | $64,328 | $10,901 | $53,427 |
| 2015 | $1,929 | $63,363 | $10,738 | $52,625 |
| 2014 | $1,921 | $62,123 | $10,528 | $51,595 |
Source: Public Records
Map
Nearby Homes