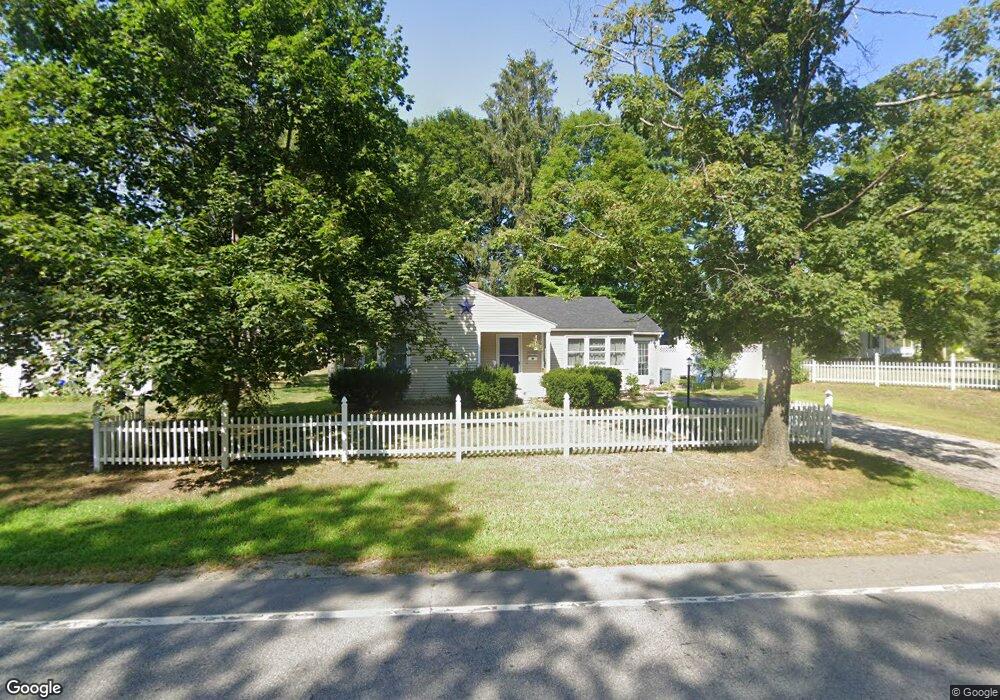
328 S Main St Concord, NH 03301
South End NeighborhoodEstimated Value: $378,934 - $448,000
2
Beds
1
Bath
1,103
Sq Ft
$368/Sq Ft
Est. Value
About This Home
This home is located at 328 S Main St, Concord, NH 03301 and is currently estimated at $405,734, approximately $367 per square foot. 328 S Main St is a home located in Merrimack County with nearby schools including Abbot-Downing School, Rundlett Middle School, and Concord High School.
Ownership History
Date
Name
Owned For
Owner Type
Purchase Details
Closed on
Aug 19, 2008
Sold by
Maynard David P and Maynard Texene C
Bought by
Maynard Krystal L
Current Estimated Value
Home Financials for this Owner
Home Financials are based on the most recent Mortgage that was taken out on this home.
Original Mortgage
$104,000
Interest Rate
6.4%
Mortgage Type
Purchase Money Mortgage
Create a Home Valuation Report for This Property
The Home Valuation Report is an in-depth analysis detailing your home's value as well as a comparison with similar homes in the area
Home Values in the Area
Average Home Value in this Area
Purchase History
| Date | Buyer | Sale Price | Title Company |
|---|---|---|---|
| Maynard Krystal L | $104,000 | -- |
Source: Public Records
Mortgage History
| Date | Status | Borrower | Loan Amount |
|---|---|---|---|
| Open | Maynard Krystal L | $99,360 | |
| Closed | Maynard Krystal L | $104,000 |
Source: Public Records
Tax History Compared to Growth
Tax History
| Year | Tax Paid | Tax Assessment Tax Assessment Total Assessment is a certain percentage of the fair market value that is determined by local assessors to be the total taxable value of land and additions on the property. | Land | Improvement |
|---|---|---|---|---|
| 2024 | $5,760 | $208,000 | $93,900 | $114,100 |
| 2023 | $5,587 | $208,000 | $93,900 | $114,100 |
| 2022 | $5,385 | $208,000 | $93,900 | $114,100 |
| 2021 | $5,210 | $207,400 | $93,900 | $113,500 |
| 2020 | $4,927 | $184,100 | $78,500 | $105,600 |
| 2019 | $4,603 | $165,700 | $75,100 | $90,600 |
| 2018 | $5,928 | $158,500 | $75,100 | $83,400 |
| 2017 | $4,298 | $152,200 | $73,700 | $78,500 |
| 2016 | $4,040 | $146,000 | $73,700 | $72,300 |
| 2015 | $3,858 | $134,200 | $67,100 | $67,100 |
| 2014 | $3,598 | $134,200 | $67,100 | $67,100 |
| 2013 | -- | $131,700 | $67,100 | $64,600 |
| 2012 | -- | $130,900 | $67,100 | $63,800 |
Source: Public Records
Map
Nearby Homes
- 105 S Main St
- 376 S Main St
- 0 South St Unit 4969509
- 122 South St
- 24 Badger St
- 33 Spruce St
- 15 Wilson Ave
- 0 Spruce St Unit 88
- 22 Wilson Ave
- 12 Avon St
- 22 Longmeadow Dr
- 289 South St
- 41 Longmeadow Dr
- 14 Downing St
- 53 Heather Ln
- 14-16 Perley St
- 47 South St
- 10 Perley St
- 87 S Main St Unit 2
- 69 Manchester St Unit Lot 18