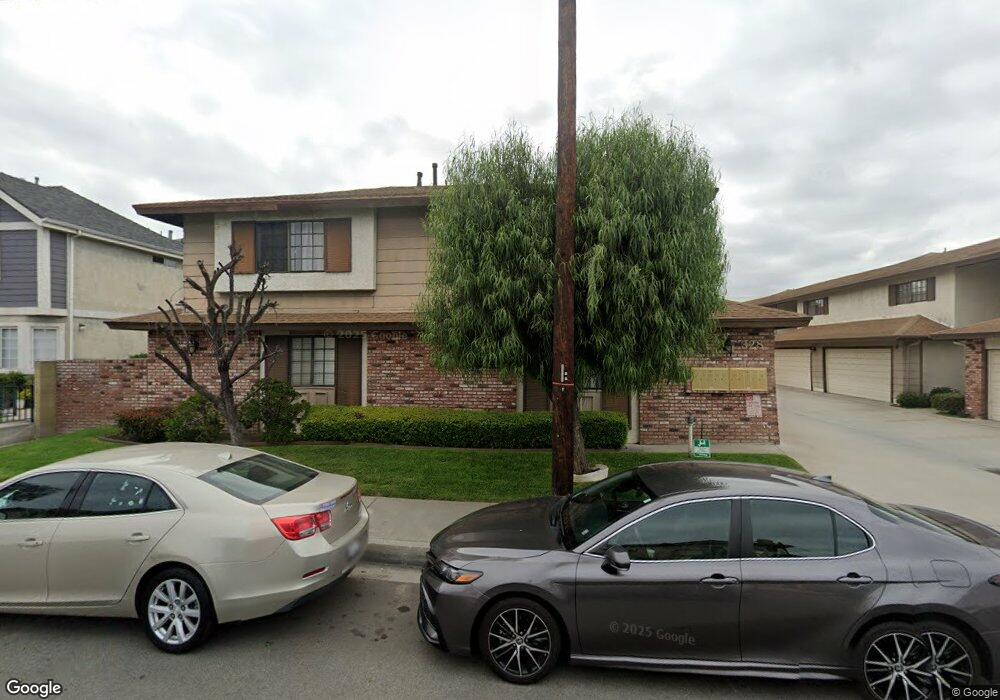
328 San Marcos St Unit A San Gabriel, CA 91776
Mission District NeighborhoodEstimated Value: $626,715 - $784,000
2
Beds
2
Baths
1,124
Sq Ft
$613/Sq Ft
Est. Value
About This Home
This home is located at 328 San Marcos St Unit A, San Gabriel, CA 91776 and is currently estimated at $689,179, approximately $613 per square foot. 328 San Marcos St Unit A is a home located in Los Angeles County with nearby schools including Coolidge Elementary School, Jefferson Middle School, and Gabrielino High School.
Ownership History
Date
Name
Owned For
Owner Type
Purchase Details
Closed on
Apr 10, 2020
Sold by
Zheng Katherine Shan Shan and Zheng Shanshan
Bought by
Zheng Katherine Shan Shan
Current Estimated Value
Home Financials for this Owner
Home Financials are based on the most recent Mortgage that was taken out on this home.
Original Mortgage
$243,800
Outstanding Balance
$215,567
Interest Rate
3.3%
Mortgage Type
New Conventional
Estimated Equity
$473,612
Purchase Details
Closed on
Mar 7, 2013
Sold by
Fnu Sutirto and Setiawan Purwati
Bought by
Zheng Shanshan
Home Financials for this Owner
Home Financials are based on the most recent Mortgage that was taken out on this home.
Original Mortgage
$280,000
Interest Rate
3.49%
Mortgage Type
New Conventional
Purchase Details
Closed on
Jan 23, 2008
Sold by
Shinozuka Kiyoe
Bought by
Fnu Sutirto
Create a Home Valuation Report for This Property
The Home Valuation Report is an in-depth analysis detailing your home's value as well as a comparison with similar homes in the area
Home Values in the Area
Average Home Value in this Area
Purchase History
| Date | Buyer | Sale Price | Title Company |
|---|---|---|---|
| Zheng Katherine Shan Shan | -- | Old Republic Title Company | |
| Zheng Shanshan | $358,000 | California Title Company | |
| Fnu Sutirto | $350,000 | Fidelity Van Nuys | |
| Shinozuka Kiyoe | -- | Fidelity Van Nuys |
Source: Public Records
Mortgage History
| Date | Status | Borrower | Loan Amount |
|---|---|---|---|
| Open | Zheng Katherine Shan Shan | $243,800 | |
| Closed | Zheng Shanshan | $280,000 |
Source: Public Records
Tax History Compared to Growth
Tax History
| Year | Tax Paid | Tax Assessment Tax Assessment Total Assessment is a certain percentage of the fair market value that is determined by local assessors to be the total taxable value of land and additions on the property. | Land | Improvement |
|---|---|---|---|---|
| 2025 | $6,059 | $440,839 | $279,282 | $161,557 |
| 2024 | $6,059 | $432,196 | $273,806 | $158,390 |
| 2023 | $5,952 | $423,723 | $268,438 | $155,285 |
| 2022 | $5,706 | $415,416 | $263,175 | $152,241 |
| 2021 | $5,664 | $407,271 | $258,015 | $149,256 |
| 2019 | $5,419 | $395,193 | $250,363 | $144,830 |
| 2018 | $5,382 | $387,445 | $245,454 | $141,991 |
| 2016 | $5,125 | $372,402 | $235,924 | $136,478 |
| 2015 | $5,054 | $366,809 | $232,381 | $134,428 |
| 2014 | $5,011 | $359,624 | $227,829 | $131,795 |
Source: Public Records
Map
Nearby Homes
- 346 San Marcos St
- 333 S Arroyo Dr Unit J
- 270 S Arroyo Dr Unit B
- 326 S Granada Ave
- 329 Orange St
- 20 S Vega St
- 219 De Anza St
- 234 De Anza St
- 115 S Granada Ave
- 300 W Las Tunas Dr
- 939 S Ramona St
- 171 Junipero Serra Dr Unit D
- 105 N El Molino St Unit E
- 418 W Fairview Ave Unit D
- 317 S Almansor St Unit 9
- 711 S Del Mar Ave Unit G
- 159 N San Marino Ave
- 32 N Almansor St Unit D
- 116 S Chapel Ave Unit J
- 122 Pearl St
- 328 San Marcos St
- 328 San Marcos St Unit K
- 328 San Marcos St Unit J
- 328 San Marcos St Unit H
- 328 San Marcos St Unit F
- 328 San Marcos St Unit E
- 328 San Marcos St Unit D
- 328 San Marcos St Unit C
- 328 San Marcos St Unit B
- 332 San Marcos St Unit H
- 332 San Marcos St Unit G
- 332 San Marcos St Unit F
- 332 San Marcos St Unit E
- 332 San Marcos St Unit D
- 332 San Marcos St Unit C
- 332 San Marcos St Unit B
- 332 San Marcos St Unit A
- 332 San Marcos St Unit J
- 338 San Marcos St Unit G