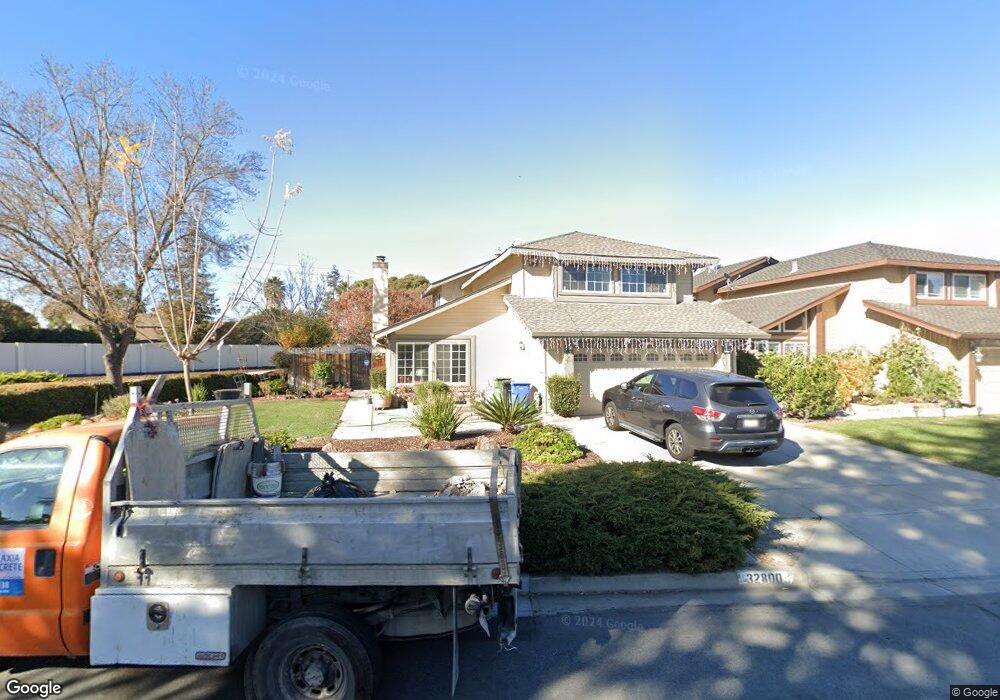
32800 Bluebird Loop Fremont, CA 94555
Alvarado NeighborhoodEstimated Value: $1,624,000 - $1,863,000
3
Beds
3
Baths
2,008
Sq Ft
$881/Sq Ft
Est. Value
About This Home
This home is located at 32800 Bluebird Loop, Fremont, CA 94555 and is currently estimated at $1,768,501, approximately $880 per square foot. 32800 Bluebird Loop is a home located in Alameda County with nearby schools including Ardenwood Elementary, Thornton Middle School, and American High School.
Ownership History
Date
Name
Owned For
Owner Type
Purchase Details
Closed on
Sep 11, 2023
Sold by
Deshpande Abhijeet Vinayak and Deshpande Tejashree A
Bought by
Deshpande Family Revocable Trust and Deshpande
Current Estimated Value
Purchase Details
Closed on
Nov 15, 2017
Sold by
Gomez Cynthia and So Elizabeth
Bought by
Deshpande Abhijeet Vinayak and Deshpande Tejashree Abhijeet
Home Financials for this Owner
Home Financials are based on the most recent Mortgage that was taken out on this home.
Original Mortgage
$825,000
Interest Rate
3.62%
Mortgage Type
Adjustable Rate Mortgage/ARM
Purchase Details
Closed on
Jul 23, 1996
Sold by
Gomez Cynthia and So Elizabeth Munsi Rob
Bought by
Gomez Cynthia and So Elizabeth
Home Financials for this Owner
Home Financials are based on the most recent Mortgage that was taken out on this home.
Original Mortgage
$33,000
Interest Rate
8.23%
Create a Home Valuation Report for This Property
The Home Valuation Report is an in-depth analysis detailing your home's value as well as a comparison with similar homes in the area
Home Values in the Area
Average Home Value in this Area
Purchase History
| Date | Buyer | Sale Price | Title Company |
|---|---|---|---|
| Deshpande Family Revocable Trust | -- | None Listed On Document | |
| Deshpande Abhijeet Vinayak | -- | None Listed On Document | |
| Deshpande Abhijeet Vinayak | $1,100,000 | First American Title Company | |
| Gomez Cynthia | -- | -- |
Source: Public Records
Mortgage History
| Date | Status | Borrower | Loan Amount |
|---|---|---|---|
| Previous Owner | Deshpande Abhijeet Vinayak | $825,000 | |
| Previous Owner | Gomez Cynthia | $33,000 |
Source: Public Records
Tax History Compared to Growth
Tax History
| Year | Tax Paid | Tax Assessment Tax Assessment Total Assessment is a certain percentage of the fair market value that is determined by local assessors to be the total taxable value of land and additions on the property. | Land | Improvement |
|---|---|---|---|---|
| 2025 | $14,707 | $1,250,544 | $375,477 | $882,067 |
| 2024 | $14,707 | $1,225,886 | $368,115 | $864,771 |
| 2023 | $14,324 | $1,208,714 | $360,897 | $847,817 |
| 2022 | $14,154 | $1,178,018 | $353,822 | $831,196 |
| 2021 | $13,802 | $1,154,786 | $346,886 | $814,900 |
| 2020 | $13,828 | $1,144,440 | $343,332 | $801,108 |
| 2019 | $13,667 | $1,122,000 | $336,600 | $785,400 |
| 2018 | $13,402 | $1,100,000 | $330,000 | $770,000 |
| 2017 | $5,237 | $405,870 | $121,665 | $284,205 |
| 2016 | $5,139 | $397,913 | $119,280 | $278,633 |
| 2015 | $5,063 | $391,937 | $117,488 | $274,449 |
| 2014 | $4,970 | $384,261 | $115,187 | $269,074 |
Source: Public Records
Map
Nearby Homes
- 4231 Hanford St
- 32542 Lake Tana St
- 4210 Comet Cir
- 4243 Comet Cir
- 3501 Lake Ontario Dr
- 3280 Grand Lake Dr
- 32814 Shaver Lake St
- 4214 Saturn Way
- 4532 Delores Dr
- 33283 Sunriver Common
- 33228 Jamie Cir
- 33010 Lake Mead Dr
- 4511 Martin St
- 32451 Regents Blvd
- 34102 Zaner Way
- 4141 Deep Creek Rd Unit 137
- 4501 Alice Way
- 192 Hawaii Cir
- 167 Kona Cir
- 33499 Quail Run Rd
- 32808 Bluebird Loop
- 32816 Bluebird Loop
- 32820 Falcon Dr
- 32824 Bluebird Loop
- 32805 Bluebird Loop
- 32832 Bluebird Loop
- 32819 Bluebird Loop
- 32840 Falcon Dr
- 4101 Hanford St
- 32855 Bluebird Loop
- 32840 Bluebird Loop
- 32825 Falcon Dr
- 32860 Falcon Dr
- 32865 Bluebird Loop
- 32848 Bluebird Loop
- 4100 Hanford St
- 32885 Bluebird Loop
- 4112 Hanford St
- 32880 Falcon Dr
- 32845 Falcon Dr