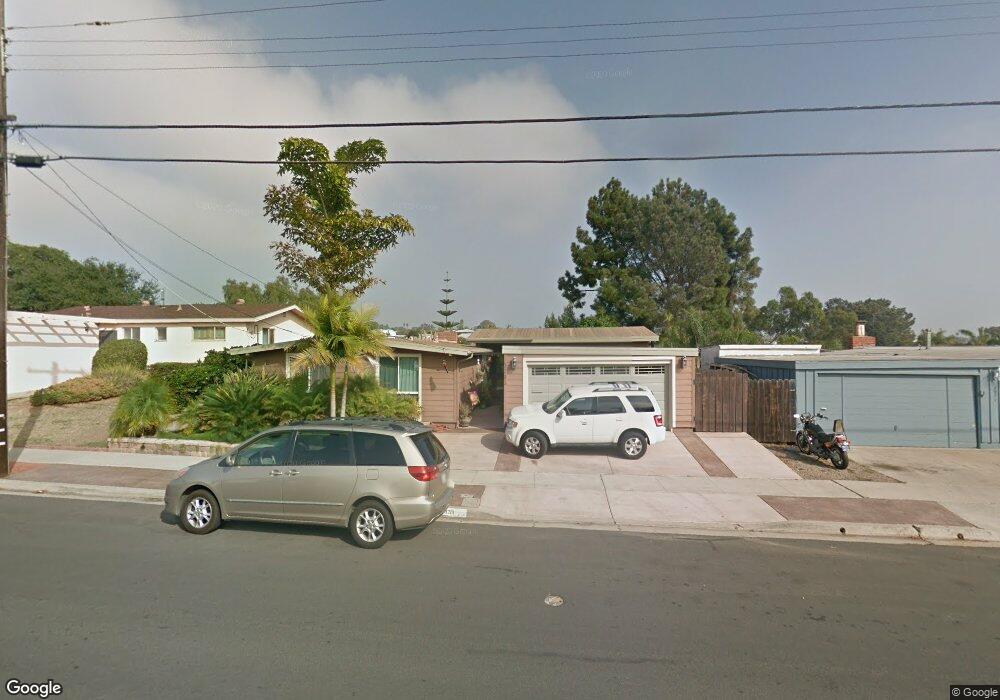
3281 Chicago St San Diego, CA 92117
Bay Park NeighborhoodEstimated Value: $1,367,000 - $1,568,000
3
Beds
2
Baths
1,488
Sq Ft
$965/Sq Ft
Est. Value
About This Home
This home is located at 3281 Chicago St, San Diego, CA 92117 and is currently estimated at $1,435,651, approximately $964 per square foot. 3281 Chicago St is a home located in San Diego County with nearby schools including Toler Elementary School, Marston Middle School, and Clairemont High School.
Ownership History
Date
Name
Owned For
Owner Type
Purchase Details
Closed on
Jan 27, 2021
Sold by
Moreau Miles F and Moreau Patricia J
Bought by
Moreau Miles and Moreau Patricia J
Current Estimated Value
Home Financials for this Owner
Home Financials are based on the most recent Mortgage that was taken out on this home.
Original Mortgage
$349,000
Outstanding Balance
$311,980
Interest Rate
2.67%
Mortgage Type
New Conventional
Estimated Equity
$1,123,671
Purchase Details
Closed on
Dec 20, 2019
Sold by
Moreau Miles Francis and Moreau Patricia J
Bought by
Moreau Miles and Moreau Patricia J
Purchase Details
Closed on
Apr 21, 1998
Sold by
Moreau Miles Francis
Bought by
Moreau Miles Francis and Moreau Patricia J
Purchase Details
Closed on
Nov 15, 1996
Sold by
Walter Gueffroy
Bought by
Moreau Miles Francis
Home Financials for this Owner
Home Financials are based on the most recent Mortgage that was taken out on this home.
Original Mortgage
$154,755
Interest Rate
7.88%
Mortgage Type
FHA
Purchase Details
Closed on
Jun 20, 1985
Create a Home Valuation Report for This Property
The Home Valuation Report is an in-depth analysis detailing your home's value as well as a comparison with similar homes in the area
Home Values in the Area
Average Home Value in this Area
Purchase History
| Date | Buyer | Sale Price | Title Company |
|---|---|---|---|
| Moreau Miles | -- | Chicago Title Company | |
| Moreau Miles F | -- | Chicago Title Company | |
| Moreau Miles | -- | None Available | |
| Moreau Miles Francis | -- | -- | |
| Moreau Miles Francis | $158,000 | Gateway Title Company | |
| -- | $103,400 | -- |
Source: Public Records
Mortgage History
| Date | Status | Borrower | Loan Amount |
|---|---|---|---|
| Open | Moreau Miles F | $349,000 | |
| Closed | Moreau Miles Francis | $154,755 |
Source: Public Records
Tax History Compared to Growth
Tax History
| Year | Tax Paid | Tax Assessment Tax Assessment Total Assessment is a certain percentage of the fair market value that is determined by local assessors to be the total taxable value of land and additions on the property. | Land | Improvement |
|---|---|---|---|---|
| 2025 | $3,853 | $324,247 | $105,942 | $218,305 |
| 2024 | $3,853 | $317,890 | $103,865 | $214,025 |
| 2023 | $3,766 | $311,658 | $101,829 | $209,829 |
| 2022 | $3,664 | $305,548 | $99,833 | $205,715 |
| 2021 | $3,638 | $299,558 | $97,876 | $201,682 |
| 2020 | $3,593 | $296,487 | $96,873 | $199,614 |
| 2019 | $3,528 | $290,674 | $94,974 | $195,700 |
| 2018 | $3,298 | $284,975 | $93,112 | $191,863 |
| 2017 | $3,218 | $279,388 | $91,287 | $188,101 |
| 2016 | $3,164 | $273,911 | $89,498 | $184,413 |
| 2015 | $3,116 | $269,797 | $88,154 | $181,643 |
| 2014 | $3,066 | $264,513 | $86,428 | $178,085 |
Source: Public Records
Map
Nearby Homes
- 3212 Donley St
- 3154 Lloyd St
- 3226 Lloyd St
- 4407 Dakota Dr
- 3467 Shawnee Rd
- 3115 Geronimo Ave
- 4654-56 Blackfoot Ave
- 2916 Chicago St
- 3526 Ticonderoga St
- 2949 Erie St
- 4732 Iroquois Ave Unit S
- 2910 Erie St
- 2841 Lloyd St
- 4603 Huron Ave
- 4507 Misty Place
- 4511 Misty Place
- C5 Plan at Mira Vista
- 4860 Canyon View
- 3244 Clairemont Dr
- 0 Trenton Ave Unit PTP2506629
- 3303 Chicago St
- 3271 Chicago St
- 3259 Chicago St
- 3309 Chicago St
- 3791 Crete St
- 3792 Crete St
- 3315 Chicago St
- 4180 Aeronca Ave
- 3249 Chicago St
- 3781 Crete St
- 3782 Crete St
- 3321 Chicago St
- 3239 Chicago St
- 4170 Aeronca Ave
- 3795 Mactibby St
- 3772 Crete St
- 3767 Crete St
- 3785 Mactibby St
- 4230 Piper St
- 4250 Piper St