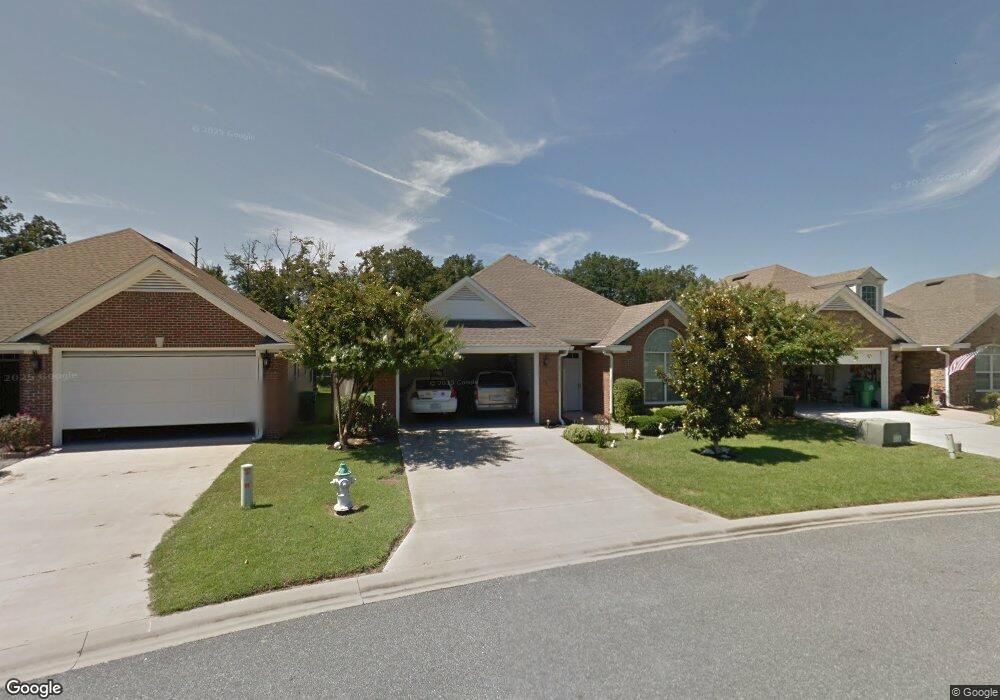
3281 Jordan Way Valdosta, GA 31605
Estimated Value: $258,497 - $300,000
3
Beds
2
Baths
1,894
Sq Ft
$146/Sq Ft
Est. Value
About This Home
This home is located at 3281 Jordan Way, Valdosta, GA 31605 and is currently estimated at $277,124, approximately $146 per square foot. 3281 Jordan Way is a home located in Lowndes County with nearby schools including Sallas Mahone Elementary School, Valdosta Middle School, and Valdosta High School.
Ownership History
Date
Name
Owned For
Owner Type
Purchase Details
Closed on
Jun 28, 2019
Sold by
Brown Belton T
Bought by
Bradford Lisa C
Current Estimated Value
Home Financials for this Owner
Home Financials are based on the most recent Mortgage that was taken out on this home.
Original Mortgage
$102,000
Outstanding Balance
$89,508
Interest Rate
3.9%
Mortgage Type
New Conventional
Estimated Equity
$187,616
Purchase Details
Closed on
Sep 15, 2006
Sold by
Stracener & Sons Construct
Bought by
Brown Belton T and Brown Joanna
Purchase Details
Closed on
Jun 22, 2005
Sold by
Stracener Bobby N
Bought by
Stracener & Sons Construction
Home Financials for this Owner
Home Financials are based on the most recent Mortgage that was taken out on this home.
Original Mortgage
$150,000
Interest Rate
5.7%
Mortgage Type
New Conventional
Purchase Details
Closed on
Aug 16, 2004
Bought by
Stracener Bobby N
Create a Home Valuation Report for This Property
The Home Valuation Report is an in-depth analysis detailing your home's value as well as a comparison with similar homes in the area
Home Values in the Area
Average Home Value in this Area
Purchase History
| Date | Buyer | Sale Price | Title Company |
|---|---|---|---|
| Bradford Lisa C | $172,000 | -- | |
| Brown Belton T | $195,000 | -- | |
| Stracener & Sons Construction | -- | -- | |
| Stracener Bobby N | -- | -- |
Source: Public Records
Mortgage History
| Date | Status | Borrower | Loan Amount |
|---|---|---|---|
| Open | Bradford Lisa C | $102,000 | |
| Previous Owner | Stracener & Sons Construction | $150,000 |
Source: Public Records
Tax History Compared to Growth
Tax History
| Year | Tax Paid | Tax Assessment Tax Assessment Total Assessment is a certain percentage of the fair market value that is determined by local assessors to be the total taxable value of land and additions on the property. | Land | Improvement |
|---|---|---|---|---|
| 2024 | $2,161 | $83,381 | $12,000 | $71,381 |
| 2023 | $2,161 | $83,381 | $12,000 | $71,381 |
| 2022 | $2,148 | $69,567 | $12,000 | $57,567 |
| 2021 | $2,210 | $69,567 | $12,000 | $57,567 |
| 2020 | $2,230 | $69,567 | $12,000 | $57,567 |
| 2019 | $2,115 | $69,567 | $12,000 | $57,567 |
| 2018 | $2,142 | $69,567 | $12,000 | $57,567 |
| 2017 | $2,157 | $69,567 | $12,000 | $57,567 |
| 2016 | $2,154 | $69,567 | $12,000 | $57,567 |
| 2015 | $1,974 | $69,567 | $12,000 | $57,567 |
| 2014 | $2,004 | $69,567 | $12,000 | $57,567 |
Source: Public Records
Map
Nearby Homes
- 3350 Country Club Rd Unit 225
- 219 Jennifer Cir
- 324 Jennifer Cir
- 3557 Victoria Dr
- 3737 Bermuda Run Dr
- 608 Pine Point Cir
- 3219 Country Club Dr
- 3504 Breckland Dr
- 3699 Arbor Run Dr
- 100 Sunnymeade Dr
- 303 Breckenridge Dr
- 323 Betty jo Dr
- 404 Northfield Rd
- 115 Brookview Terrace
- 5 Saint Andrews Cir
- 2919 Thea Ln
- 5 Post Pointe Cir
- 3022 Blandwood Rd
- 2905 Northfield Rd
- 309 Barfield Dr
- 3285 Jordan Way
- 3277 Jordan Way
- 3289 Jordan Way
- 3273 Jordan Way
- 3276 Jordan Way
- 3288 Jordan Way
- 3293 Jordan Way
- 3269 Jordan Way
- 3297 Jordan Way
- 3265 Jordan Way
- 3262 Jordan Way
- 3296 Jordan Way
- 3301 Jordan Way
- 3427 Drayton Cir
- 3433 Drayton Cir
- 3421 Drayton Cir
- 3300 Jordan Way
- 3337 Noble Way
- 3439 Drayton Cir
- 3425 Greystone Way