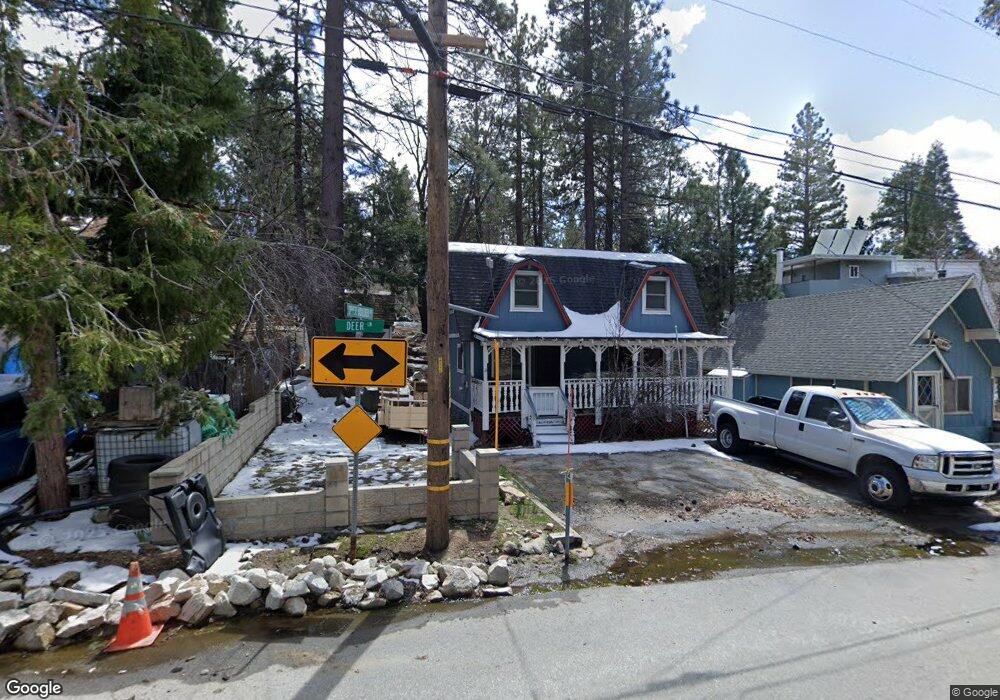
32869 Deer Ln Running Springs, CA 92382
Estimated Value: $245,000 - $363,000
2
Beds
2
Baths
1,120
Sq Ft
$270/Sq Ft
Est. Value
About This Home
This home is located at 32869 Deer Ln, Running Springs, CA 92382 and is currently estimated at $302,901, approximately $270 per square foot. 32869 Deer Ln is a home with nearby schools including Charles Hoffman Elementary School, Mary P. Henck Intermediate School, and Rim Of The World Senior High School.
Ownership History
Date
Name
Owned For
Owner Type
Purchase Details
Closed on
Nov 18, 2020
Sold by
Ramage Richard
Bought by
Terrones Art and Terrones Laura
Current Estimated Value
Purchase Details
Closed on
Jan 14, 2013
Sold by
Santana Jonathan and Santana Valerie
Bought by
Ramage Richard
Purchase Details
Closed on
Aug 8, 2006
Sold by
Mitchell Keven R and Mitchell Nancy A
Bought by
Santana Jonathan and Santana Valerie
Home Financials for this Owner
Home Financials are based on the most recent Mortgage that was taken out on this home.
Original Mortgage
$37,600
Interest Rate
6.67%
Mortgage Type
Stand Alone Second
Purchase Details
Closed on
Apr 12, 1996
Sold by
Mitchell Kevin R and Mitchell Keven R
Bought by
Mitchell Kevin R and Mitchell Nancy A
Home Financials for this Owner
Home Financials are based on the most recent Mortgage that was taken out on this home.
Original Mortgage
$78,888
Interest Rate
7.84%
Mortgage Type
FHA
Create a Home Valuation Report for This Property
The Home Valuation Report is an in-depth analysis detailing your home's value as well as a comparison with similar homes in the area
Home Values in the Area
Average Home Value in this Area
Purchase History
| Date | Buyer | Sale Price | Title Company |
|---|---|---|---|
| Terrones Art | -- | Accommodation | |
| Ramage Richard | $60,000 | Chicago Title Company | |
| Santana Jonathan | $188,000 | First American | |
| Mitchell Kevin R | -- | Continental Lawyers Title Co |
Source: Public Records
Mortgage History
| Date | Status | Borrower | Loan Amount |
|---|---|---|---|
| Previous Owner | Santana Jonathan | $37,600 | |
| Previous Owner | Santana Jonathan | $150,400 | |
| Previous Owner | Mitchell Kevin R | $78,888 |
Source: Public Records
Tax History Compared to Growth
Tax History
| Year | Tax Paid | Tax Assessment Tax Assessment Total Assessment is a certain percentage of the fair market value that is determined by local assessors to be the total taxable value of land and additions on the property. | Land | Improvement |
|---|---|---|---|---|
| 2025 | $1,119 | $73,885 | $12,314 | $61,571 |
| 2024 | $1,119 | $72,437 | $12,073 | $60,364 |
| 2023 | $1,109 | $71,016 | $11,836 | $59,180 |
| 2022 | $1,091 | $69,624 | $11,604 | $58,020 |
| 2021 | $1,082 | $68,258 | $11,376 | $56,882 |
| 2020 | $1,082 | $67,558 | $11,259 | $56,299 |
| 2019 | $1,060 | $66,233 | $11,038 | $55,195 |
| 2018 | $1,012 | $64,935 | $10,822 | $54,113 |
| 2017 | $998 | $63,662 | $10,610 | $53,052 |
| 2016 | $974 | $62,414 | $10,402 | $52,012 |
| 2015 | $968 | $61,477 | $10,246 | $51,231 |
| 2014 | $953 | $60,272 | $10,045 | $50,227 |
Source: Public Records
Map
Nearby Homes
- 32868 Deer Ln
- 0 Upper Boulder Rd
- 32947 Squirrel Ln
- 32961 Squirrel Ln
- 32826 Truman Ln
- 00 Upper Boulder Rd
- 32979 Deer Ln
- 32871 Cougar Ln
- 32784 Richmond Dr
- 0 Hilltop Blvd Unit ND25079923
- 32801 Encina Dr
- 33026 Donner Ln
- 0 Arrowbear Dr
- 0 Encina Dr Unit IG24219614
- 32780 Cougar Ln
- 0 Tulip Ln
- 0 Elko Dr Unit 219131942DA
- 33020 Arrowbear Dr
- 2412 Ridge Dr
- 32796 Lupine Ln
- 32867 Lower Boulder Rd
- 32872 Squirrel Ln
- 32868 Lower Boulder Rd
- 32869 Deer Ln
- 32884 Squirrel Ln
- 2251 Deep Creek Dr
- 32868 Squirrel Ln
- 2255 Deep Creek Dr
- 32896 Squirrel Ln
- 2242 Deep Creek Rd
- 32905 Deer Ln
- 2211 Deep Creek Dr
- 0 Deep Creek Unit EV16724211
- 0 Deep Creek Unit SW17134378
- 32876 Upper Boulder Rd
- 2750 Deer Ln
- 32829 Badger Ln
- 32895 Squirrel Ln
- 2205 Deep Creek Dr
- 32895 Squirrel Dr