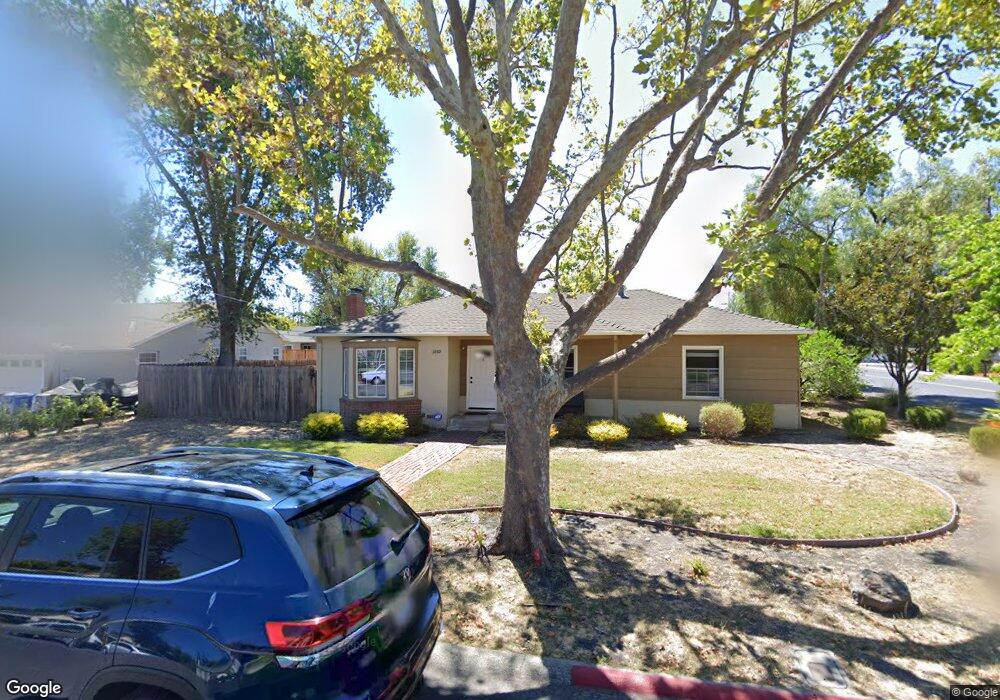
3289 Rogers Ave Walnut Creek, CA 94597
Larkey Park NeighborhoodEstimated Value: $1,185,254 - $1,452,000
4
Beds
2
Baths
1,837
Sq Ft
$705/Sq Ft
Est. Value
About This Home
This home is located at 3289 Rogers Ave, Walnut Creek, CA 94597 and is currently estimated at $1,294,814, approximately $704 per square foot. 3289 Rogers Ave is a home located in Contra Costa County with nearby schools including Pleasant Hill Elementary School, Pleasant Hill Middle School, and College Park High School.
Ownership History
Date
Name
Owned For
Owner Type
Purchase Details
Closed on
Nov 6, 2015
Sold by
Patrick Lyman & Associates Llc
Bought by
Khorami Mohammad Mehdi Eskandar Pour and Farnam Shirin
Current Estimated Value
Home Financials for this Owner
Home Financials are based on the most recent Mortgage that was taken out on this home.
Original Mortgage
$628,000
Outstanding Balance
$494,120
Interest Rate
3.8%
Mortgage Type
New Conventional
Estimated Equity
$800,694
Purchase Details
Closed on
Nov 17, 2014
Sold by
Deboer John
Bought by
Patrick Lyman & Associates Llc
Purchase Details
Closed on
Jan 5, 2004
Sold by
Lee Mirte Deboer and Deboer Michael Diederic
Bought by
Deboer John and Deboer John Fulton
Home Financials for this Owner
Home Financials are based on the most recent Mortgage that was taken out on this home.
Original Mortgage
$390,000
Interest Rate
3.61%
Mortgage Type
Negative Amortization
Purchase Details
Closed on
Oct 29, 1996
Sold by
Jean Deboer
Bought by
Deboer Jean
Create a Home Valuation Report for This Property
The Home Valuation Report is an in-depth analysis detailing your home's value as well as a comparison with similar homes in the area
Home Values in the Area
Average Home Value in this Area
Purchase History
| Date | Buyer | Sale Price | Title Company |
|---|---|---|---|
| Khorami Mohammad Mehdi Eskandar Pour | $785,000 | Old Republic Title Company | |
| Patrick Lyman & Associates Llc | $580,000 | None Available | |
| Deboer John | $260,000 | Chicago Title | |
| Deboer John Fulton | -- | Chicago Title | |
| Deboer Jean | -- | -- |
Source: Public Records
Mortgage History
| Date | Status | Borrower | Loan Amount |
|---|---|---|---|
| Open | Khorami Mohammad Mehdi Eskandar Pour | $628,000 | |
| Previous Owner | Deboer John | $390,000 |
Source: Public Records
Tax History Compared to Growth
Tax History
| Year | Tax Paid | Tax Assessment Tax Assessment Total Assessment is a certain percentage of the fair market value that is determined by local assessors to be the total taxable value of land and additions on the property. | Land | Improvement |
|---|---|---|---|---|
| 2025 | $10,884 | $929,275 | $583,491 | $345,784 |
| 2024 | $10,709 | $911,054 | $572,050 | $339,004 |
| 2023 | $10,709 | $893,191 | $560,834 | $332,357 |
| 2022 | $10,617 | $875,679 | $549,838 | $325,841 |
| 2021 | $10,382 | $858,509 | $539,057 | $319,452 |
| 2019 | $10,168 | $833,047 | $523,069 | $309,978 |
| 2018 | $9,802 | $816,713 | $512,813 | $303,900 |
| 2017 | $9,494 | $800,700 | $502,758 | $297,942 |
| 2016 | $9,273 | $785,000 | $492,900 | $292,100 |
| 2015 | $7,840 | $650,000 | $450,000 | $200,000 |
| 2014 | $6,547 | $538,624 | $340,152 | $198,472 |
Source: Public Records
Map
Nearby Homes
- 1933 Oak Park Blvd
- 256 Douglas Ln
- 53 Monte Cresta Ave
- 105 Laurel Oak Dr
- 406 Ivy Ln
- 155 Via Del Sol
- 1590 Sunnyvale Ave Unit 31
- 1912 Vicki Ln
- 1089 Wesley Ct Unit 8
- 130 Wyatt Cir
- 1064 Wesley Ct Unit 2
- 11 Forest Hills Ct
- 1539 Geary Rd Unit C
- 218 Avant Place
- 404 Beatrice Rd Unit 3
- 312 Soule Ave
- 1015 Pleasant Valley Dr
- 1007 Pleasant Valley Dr
- 26 Warhol Way
- 190 Cleaveland Rd Unit 12
- 3281 Rogers Ave
- 3280 Hudson Ave
- 3288 Rogers Ave
- 3273 Rogers Ave
- 3069 Putnam Blvd
- 3280 Rogers Ave
- 3272 Hudson Ave
- 3065 Putnam Blvd
- 6 Rogers Ct
- 3272 Rogers Ave
- 3265 Rogers Ave
- 3289 Hudson Ave
- 3158 Putnam Blvd
- 3264 Hudson Ave
- 3281 Hudson Ave
- 3281 Mcnutt Ave
- 3063 Putnam Blvd
- 44 Rogers Ct
- 3264 Rogers Ave
- 12 Rogers Ct